


INTRODUCTION
Overactive bladder (OAB) is characterized by the symptom of urinary urgency that is generally accompanied by frequent daytime voiding or nocturia, with or without urinary incontinence (UI), in the absence of urinary tract infection or other detectable diseases [1]. OAB is a prevalent condition in males and females, and the prevalence increases with age [2]. In Korea, about 10% of men and 14.3% of women had OAB [3] and in America, 17% of men and 30% of women experienced OAB symptoms sometimes or often [4]. In China and Korea, about 20% of people aged over 40 years had OAB symptoms [2] and in eastern Europe, 39.5% of women and 26.8% of men had these symptoms [5].
OAB negatively impacts psychological and physical health. People with OAB are more likely to experience depression, anxiety, embarrassment, or shame, and hence, their quality of life (QoL) is low [6]. Specifically, among OAB women, the higher the depression and anxiety scores, the greater the severity of OAB symptoms [7]. Moreover, when comparing health-related QoL scores between people without OAB and those with severe OAB, the latter had 30% lower scores [8]. OAB also affects sexual function, working activity, and sleep. One study found that the total sexual function score was significantly different between OAB women and non-OAB women: the higher the severity of symptoms, the weaker the sexual function [9,10]. Regarding work activity, people with OAB felt 32.1% of their working time was affected by OAB symptoms and 6.5% of people felt the symptoms affected their work time [11]. Moreover, people with OAB had a higher risk of insomnia and were more likely to have sleep disturbance [12,13].
Behavioral therapies for OAB such as lifestyle modifications are recommended for the first-line treatment by the American Urological Association [14], because of their significant benefits and few side effects [15]. In addition, it is difficult to manage the symptoms completely with medication alone, so behavioral therapies are important [16]. For older adults, lifestyle modifications, one of the behavioral therapies, can be easily applied because they are simple [17]. They include fluid and caffeine intake modification, weight control, constipation management, and smoking cessation [15]. It was reported that lifestyle modifications such as adequate fluid intake, diet, and weight control, reduced OAB symptoms and improved psychological symptoms and QoL among women with OAB [18]. Moreover, a study revealed that co-morbid dysfunctions such as nocturia and sleep disturbance improved when the severity of OAB symptoms decreased by lifestyle interventions [19].
Fluid and caffeine intake modifications are considered to be one of the easiest ways to manage OAB because they are cost-effective, noninvasive, and easy to access [20]. The evidence suggests that fluid or caffeine intake modification was associated with lower urinary tract symptoms (LUTS), urinary urgency, and frequency [21,22]. There are also some recommendations to consume 6 to 8 glasses of water per day, keep away from fluid intake 2 to 3 hours before bed, and reduce caffeine intake [15].
Although there were these benefits of fluid and caffeine intake modifications for people with OAB symptoms, no previous study synthesizes the evidence on the effects of fluid and caffeine intake and analyzed them systematically.
This study aimed to review and summarize available scientific evidence about the effects of fluid or caffeine intake modifications on community-dwelling adults with symptoms of OAB.
METHODS
Study Design
A systematic review of randomized controlled trial (RCT) studies and quasi-experimental studies (QESs) which evaluated the effectiveness of fluid or caffeine intake modifications on OAB symptoms in adults. A QES is an experimental study without randomization or a control group [23]. The study protocol was prospectively registered on PROSPERO (No. CRD42022293799).
Searching for and Selecting Studies
Studies were searched electronically by using PubMed, CINAHL (Cumulative Index for Nursing and Allied Health Literature), Embase, Scopus, the Cochrane Library, KoreaMed, and RISS (Research Information Sharing Service) databases. Only studies published until February 2022 and written in English or Korean were included. The search terms included: (“OAB” OR “UI” OR “LUTS”) AND (“fluid modification” OR “caffeine intake”) (Supplementary Material 1). Citation tracking was also used to identify additional studies.
The inclusion criteria were as follows: (1) studies that included community-dwelling adults with OAB as participants; (2) studies that implemented fluid or caffeine intake modification interventions; (3) RCT or QES; (4) studies that reported urinary frequency, urgency, nocturia, urine leakage episodes or amount, or QoL as outcome variables. The exclusion criteria were as follows: (1) studies that included people with UI after surgery and admitted to a health institution; (2) studies with people who have a urinary disorder due to another disease as participants; (3) pharmacological or surgical treatment. Two independent researchers reviewed the search results by these criteria and through discussions, the final included studies were selected.
Risk of Bias in Included Studies
To examine the risk of bias of included studies, Cochrane tool for assessing the risk of bias (RoB 2.0) and Risk Of Bias In Non-randomized Studies - of Interventions (ROBINS-I) were applied. RoB 2.0 had 5 domains, and each criterion was appraised as high, low, or having some concerns regarding bias [24]. ROBINS-I had 7 domains, and each domain was assessed as low, moderate, serious, critical, or not informed [25]. After assessing RoB independently, the 2 researchers cochecked the results and if there were any disagreements or misunderstandings, they reached an agreement through discussion.
Data Extraction
Data extraction was performed by including first author, publication year, country where the study was conducted, design, inclusion and exclusion criteria, settings, participants’ mean age, the number of participants in each study group (experimental and control groups), content of intervention, duration of intervention, time of measuring, outcome variables and findings. The data were cross-checked by 2 independent researchers.
RESULTS
Search Outcome
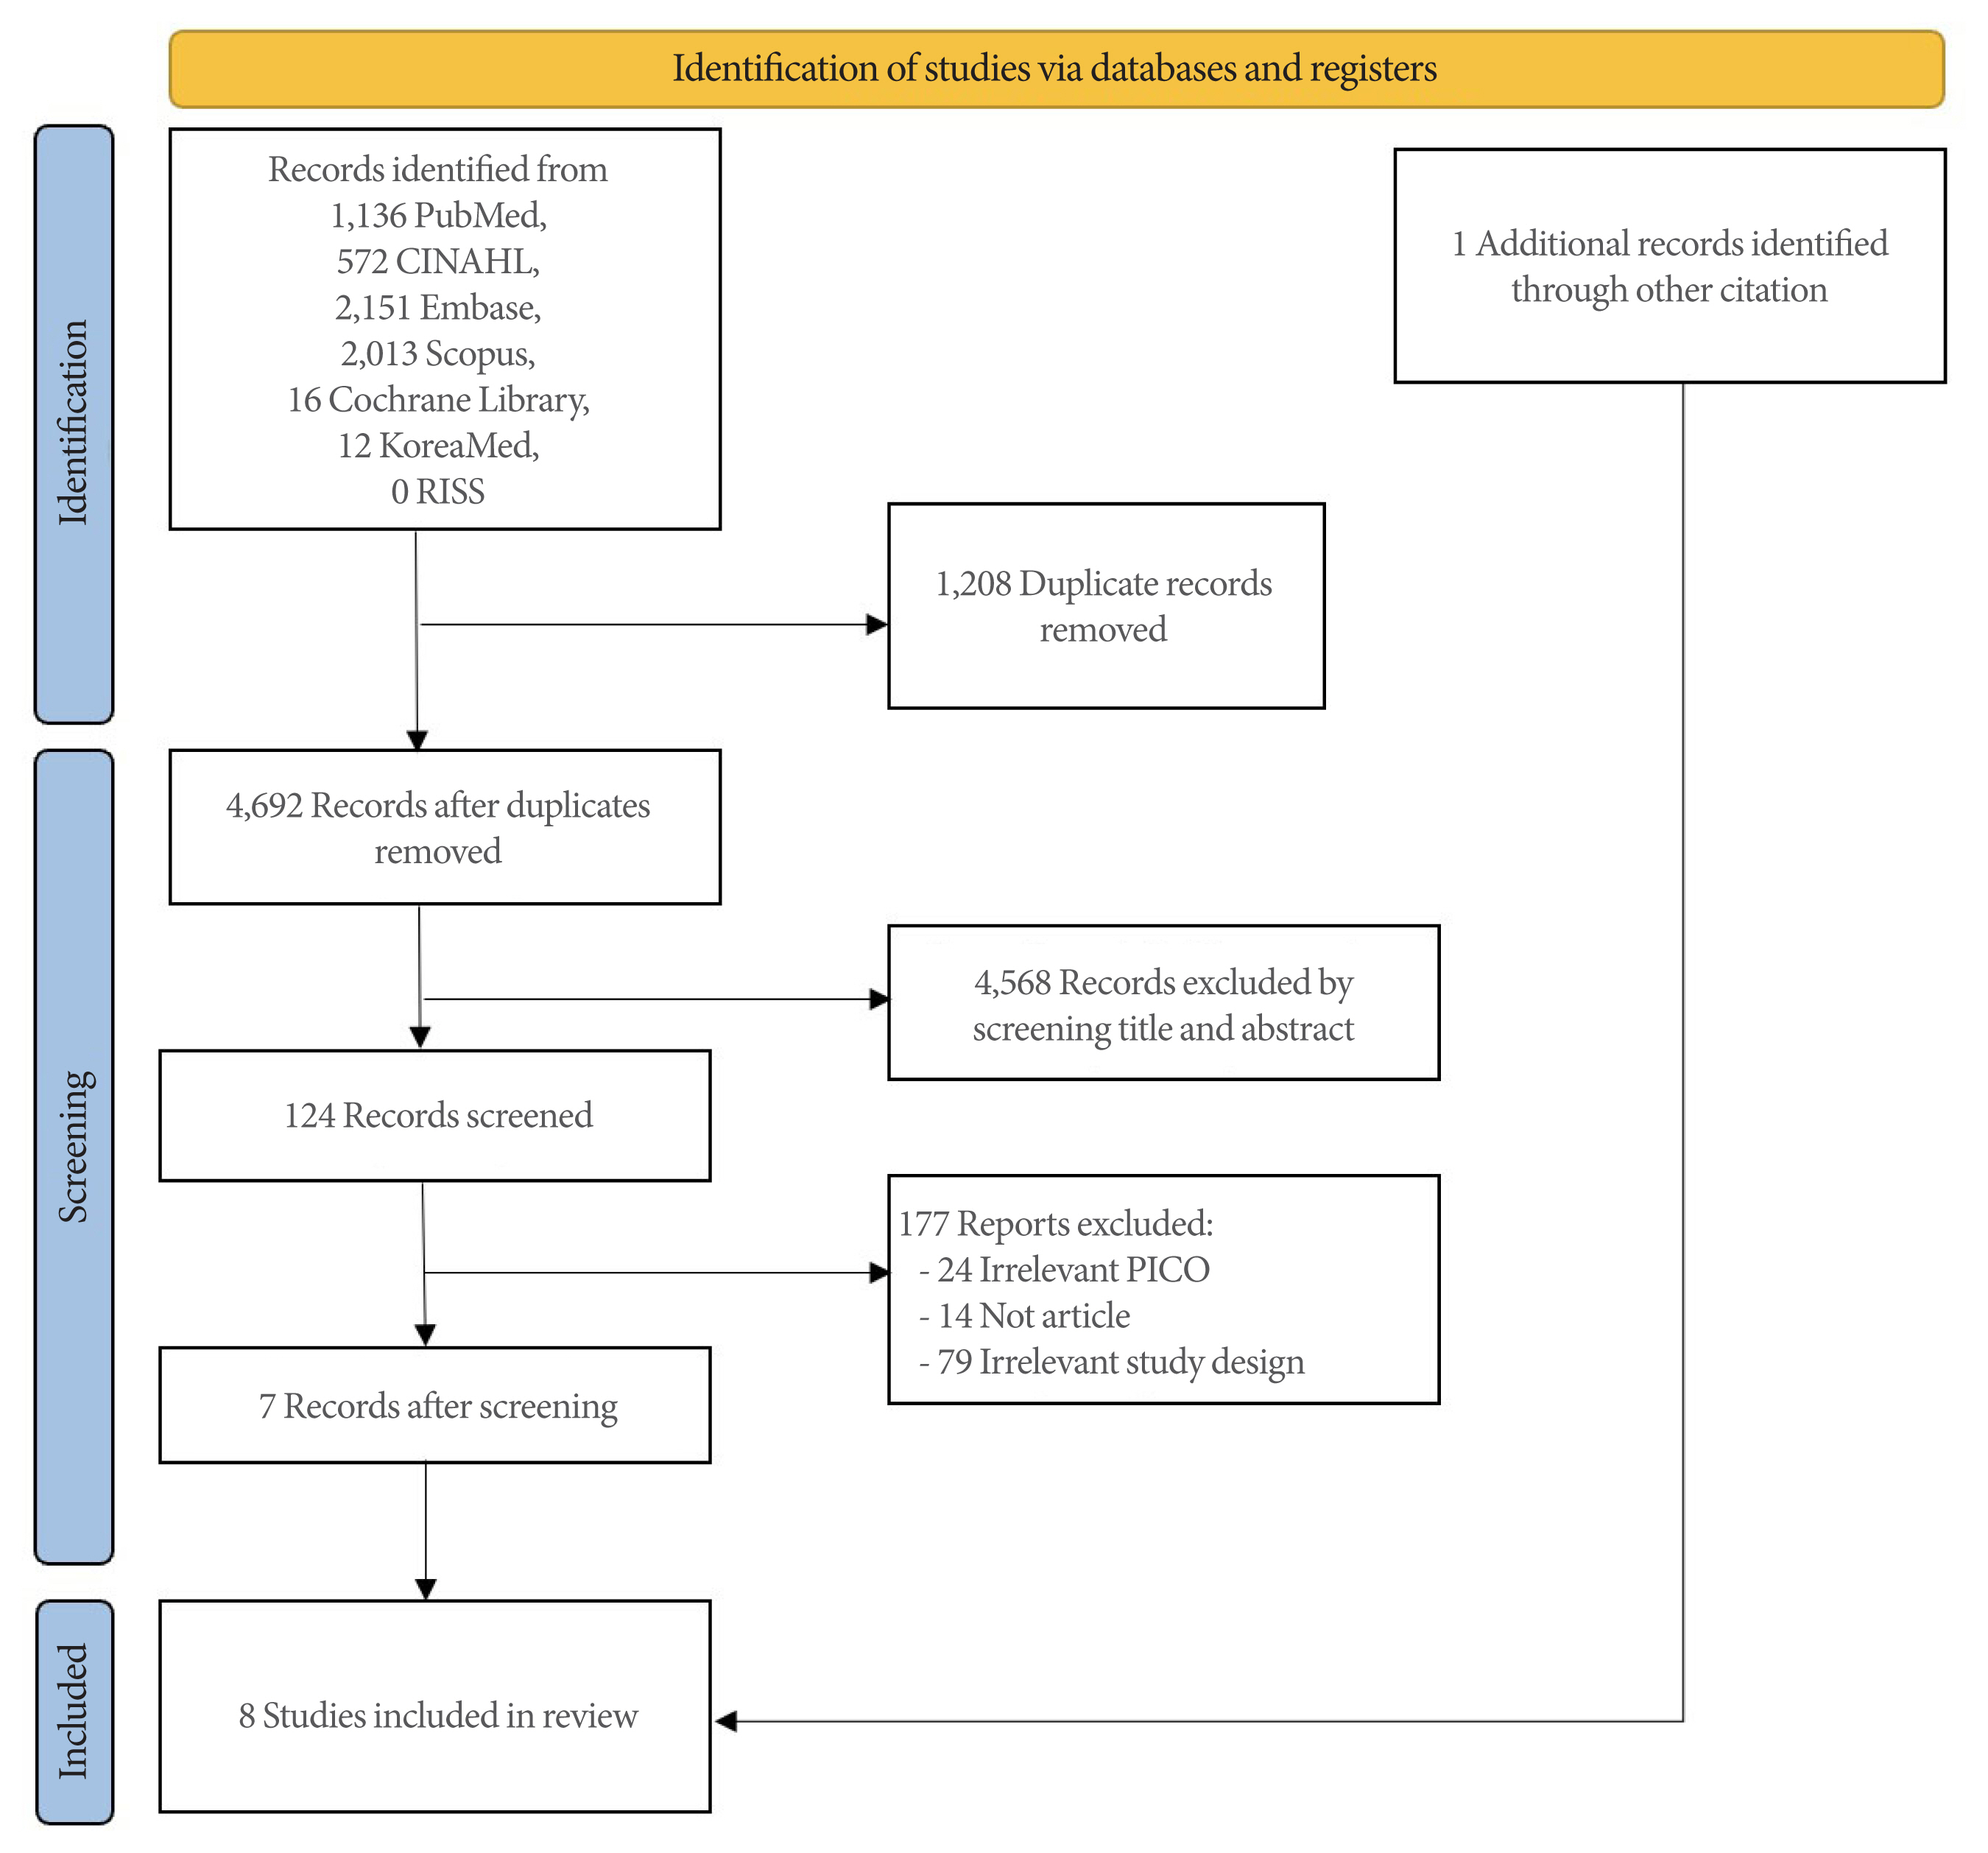
A total of 5,900 articles were obtained through database searching, and after removing duplicates, 4,692 remained. After screening the titles, 4,568 articles were excluded. The remaining 124 were examined by screening abstracts. A total of 112 studies were excluded; 19 had an irrelevant population (P), intervention (I), control (C) and/or outcomes (O), 14 were not original articles, and 79 had irrelevant study designs. Through this process, 12 articles were reviewed by their full texts, and 5 were excluded because of irrelevant data and intervention.
Finally, 8 studies were included since one additional study was found by citation tracking. The PRISMA (Preferred Reporting Items for Systematic Reviews and Meta-Analyses) flow chart shows an overview of the study selection process (Fig. 1).
Characteristics of Studies and Interventions
Table 1 presents the general characteristics of the 8 studies. There were 7 RCTs and one QES, and all studies were published in academic journals. Three were conducted in the United States of America, 2 in the United Kingdom, and 1 each in Australia, Japan, and the Netherlands. There were 5 studies on women, 1 on men, and 2 on both, and participants’ mean age was over 50 in all studies.
Interventions could be divided into 3 main categories: caffeine modification only, fluid modification only, and fluid and caffeine modification.
Two studies restricted caffeine intake. Bryant et al. [26] restricted caffeine to less than 100 mg a day and provided bladder training. Wells et al. [27] divided the participants into 2 groups and allowed them to drink caffeine or decaffeinated drinks for 14 days. Then, each group was allowed to drink decaffeinated or caffeine drinks on the contrary after a 14-day washout period.
The 2 periods were compared.
Two studies controlled the amount of fluid intake. Dowd et al. [28] asked participants drink fluid less, more, or maintain their current amount, and Spigt et al. [29] asked the intervention group to drink 1.5 L of extra water per day.
A total of 4 studies modified both caffeine and fluid intake. Kincade et al. [30] provided individualized counseling regarding self-monitoring techniques for adequate caffeine and fluid consumption and simple pelvic floor muscle training (PFMT). Kyoda et al. [31] provided cognitive behavioral therapy (CBT), which included caffeine restriction and decreased water intake in the evening. Swithinbank et al. [32] asked patients with urodynamic stress incontinence and idiopathic detrusor overactivity to restrict their caffeine intake for 3 weeks. During the last 2 weeks of caffeine restriction, participants were divided into increasing or decreasing fluid intake groups. Tomlinson et al. [33] provided self-monitoring techniques to manage their continence symptoms, such as decreasing caffeine and increasing fluid intake.
Risk of Bias in Included Studies
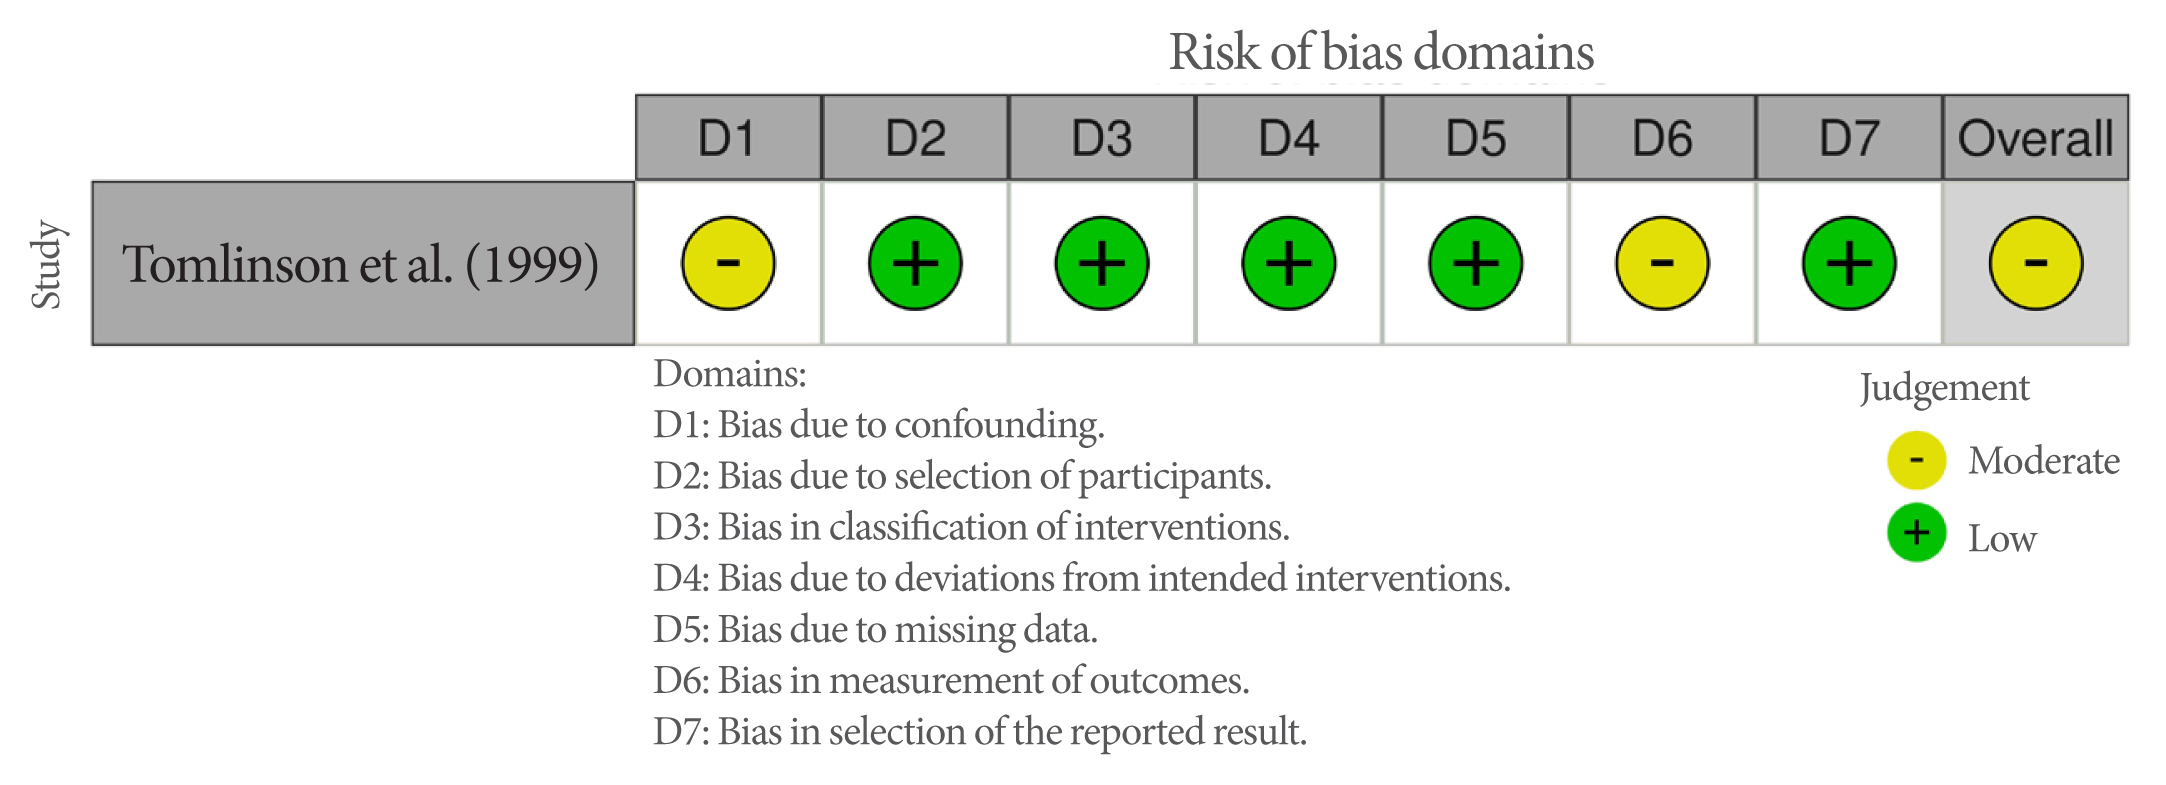
Figs. 2 and 3 presents the RoB results among the included studies. Overall, RoB was low in 4, high in 3 studies, and moderate in 1 QES.
For RCTs, all studies were at low risk regarding the measurement of the outcome and deviation from intended interventions. Regarding the randomization process, 5 studies were at low risk and 2 had some concerns because 2 did not explain the exact method of randomization. Four studies were at low risk regarding missing outcome data and 3 were at high risk. Studies with high risk had not only incomplete outcome data, but they also did not mention how they handled the dropouts. Furthermore, there was no specific evidence that the result was not biased because of missing outcome data. Four RCTs were at low risk, and the other 3 had some concerns regarding the selection of the reported result. This is because of the lack of information regarding whether the data were analyzed according to a prespecified analysis plan.
For the QES, selection of participants, classification of interventions, deviations from intended interventions, missing data and selection of the reported result were at low risk, and confounding and measurement of outcomes were at moderate risk of bias. Tomlinson et al. [33] did an initial assessment such as physical assessment and health history, potential confounding could still exist. In addition, outcome assessors were aware of the intervention, this could be the risk of bias.
Outcomes
Table 2 shows the intervention effect of the included studies through the outcome variables urinary urgency, urinary frequency, UI, nocturia, and QoL.
Urinary urgency
Four studies assessed urinary urgency, and it was reported by the number of urgency episodes in 24 hours or the score of the International Prostate Symptom Score (IPSS) which evaluates irritative symptoms. Studies that restricted caffeine intake [26,27] reported fewer urgency episodes in the intervention group than the control group. In the study by Spigt et al. [29], both 2 groups had differences between baseline and after the intervention, but the control group indicated bigger differences than the intervention group from 5.7 to 4.4 of the IPSS score. Swithinbank et al. [32] compared fluid increase and decrease groups among IDO participants. The urgency episodes were increased in the group who increase fluid intake and decreased in the group drinking less fluid.
Urinary frequency
Urinary frequency was reported in 5 studies by assessing the number of voids in 24 hours. Studies that reduced caffeine intake found significant improvement in both groups with the intervention group showing a more significant effect than the comparative group [26,27]. However, when managing both caffeine and fluid intake [31–33], it was reported that increasing fluid intake increased the number of urinary voids.
Urinary incontinence
The episodes or amount of UI were assessed by 6 studies. Caffeine restriction resulted in fewer UI episodes in the intervention group than the control group, but it was not statistically significant [26,27]. Dowd et al. [28] compared UI episodes among 3 groups and found that decreasing fluid had more effect on UI than increasing or maintaining fluid intake. Kincade et al. [30] measured the amount of urine loss and found significant improvement in the intervention group. Tomlinson et al. [33] found improvement in UI from completing a self-monitoring phase. One study showed caffeine plus fluid reduction was more effective in reducing UI episodes than caffeine reduction with fluid increase among IDO patients [32].
Nocturia
Two studies reported this outcome. Wells et al. [27] measured nocturia with an international consultation on the incontinence-overactive bladder module (ICIQ-OAB) score. In the decaffeinated period, nocturia symptoms improved. Kyoda et al. [31] assessed nighttime frequency and episodes of nocturia for one day and found significant improvement in the intervention group.
DISCUSSION
This systematic review was conducted to assess the effectiveness of interventions for fluid and/or caffeine intake modification in adults with OAB. The main finding suggests caffeine intake restriction as a priority in managing OAB symptoms because all outcome variables improved, and reducing fluid intake was more effective than increasing it. However, most results were not statistically significant. Regarding applying caffeine and fluid modification interventions to OAB adults, decreasing caffeine and fluid intake was more effective for improving urinary frequency, urgency, UI, and QoL.
Regarding the effectiveness of decreasing caffeine intake, Kosilov et al. [34] found differences in daytime and nighttime urinary frequency, urgency, and UI episodes between older adults who consumed more than 300 mg of caffeine per day as tea or coffee and those who consumed less than 300 mg per day [34]. It was also found that the United States women whose caffeine intake was more than 204 mg per day were more likely to have UI [35]. Among the studies included in this research, caffeine was mostly consumed as a beverage (e.g., coffee, tea, and soft drinks) except in one where it was also consumed in the form of chocolates and medications. Most included studies that reduced caffeine intake also used the method of replacing caffeine with decaffeinated fluids to restrict the intake. Also, other previous studies often controlled caffeine in beverages [34,35], which means that the exact amount was not measured because caffeine contained in other foods or drugs was not included. Moreover, since most included studies measured caffeine intake by self-reporting, a reporting error is possible. Therefore, accurate information and guidelines on caffeine, including beverages and foods, are needed to modify caffeine intake.
This review also found that when fluid intake was decreased, OAB symptoms were relieved [28,31,32]. This result is consistent with several previous studies that showed fluid reduction was more effective [20,36]. However, excessive reduction of fluid intake can cause dehydration, and hence, it negatively impacts OAB symptoms [37]. Inadequate hydration status may critically affect older adults and results in dehydration, hypotension, and constipation [38]. Therefore, maintaining the appropriate fluid intake is important but there is no exact guideline for OAB adults. Previous studies also suggested that in the case of polydipsia, a gradual reduction of total daily fluid was needed by total of 1.5–2 L per day for adult women with OAB symptoms [39]. Another study suggested that restricting fluid intake to 6 to 8 glasses of water per day was effective in relieving OAB symptoms [40]. Moreover, in this review, the participants might not report the exact amount of fluid because some foods such as fruits or soup also contained fluid but it is hard to measure. Therefore, future studies should identify the appropriate amount of fluid intake for older adults with OAB symptoms and consider a suitable method for accurate measuring of fluid intake.
Among the outcome variables, UI was evaluated by 6 studies, but only 2 identified statistically significant results. Kincade et al. [30] found that the amount of urine lost was decreased in the experimental group after the intervention, especially for women who had 9 or more episodes of UI per day. Swithinbank et al. [32] found that increased fluid intake improved SUI symptoms, while decreased fluid intake was associated with improvement in both SUI and IDO symptoms, especially so for SUI. There are several UI types, such as stress, urge, and mixed. The symptoms of each UI type are different, but most studies included in this review did not distinguish between them. Swithinbank et al. [32] analyzed the results by dividing them into SUI and IDO groups, but the remaining studies included all types of UI or only urge UI.
Since the symptoms of each UI type are different, interventions should be changed accordingly [41]. However, possibly because the interventions were applied collectively and the results were not statistically significant. Moreover, according to previous studies, fluid intake may not influence an incident rate of UI, but increased caffeine intake was likely to increase the number of urge UI episodes. Hence, there was no need to reduce fluid intake to control UI, but reducing caffeine was helpful [42,43]. Moreover, the National Institute for Health and Care Excellence guideline suggested that women with UI could modify their fluid intake as high or low, but it did not indicate the applicable methods for each subtype of UI in detail [44]. Therefore, more studies should be conducted to identify the exact intake of fluid and caffeine by UI types.
This study has several limitations. First, there is a lack of the experimental studies required for better evaluation of lifestyle modification and other interventions for OAB symptoms. Only 8 intervention studies were selected, indicating that a small number of interventional studies has been conducted. Moreover, only 2 were published within the last 10 years. This result is opposed to the study of Park and Kim [45] that the number of nonpharmaceutical intervention research studies was increasing. It is because this review only included studies with fluid and caffeine modification interventions among various nonpharmaceutical interventions such as education, acupuncture, or exercise. Moreover, recent studies have provided mixed interventions of pharmacological and nonpharmacological interventions rather than solely modifying fluid and/or caffeine intake [46,47]. Furthermore, there are other behavioral therapies, such as PFMT, bladder training, lifestyle modifications, constipation management, and weight control [39], making various kinds of experimental studies. There is a need to confirm whether lifestyle modifications that are easily accessible, such as fluid and caffeine modifications, can be as effective as other interventions for better OAB therapy. This is because feasibility, adherence, and sustainability that result from accessibility should be considered as a part of the criteria for the optimal intervention. Therefore, further lifestyle modification intervention trials need to be conducted.
Second, it cannot be guaranteed whether the results of the included studies were directly affected by fluid and/or caffeine modifications. More than half of them included fluid or caffeine modification as a part of their whole intervention. Bryant et al. [26], for example, provided education on caffeine reduction and bladder training. Kincade et al. [30] conducted studies with interventions involving individualized counseling that included self-monitoring techniques about caffeine consumption and fluid intake, and PFMT. In the study by Kyoda et al. [31], fluid and caffeine modifications were part of their CBT, and Tomlinson et al. [33] provided self-monitoring interventions such as behavioral therapy, which included reducing caffeine and increasing water intake. It indicates that the results may not be derived from the effects of fluid or caffeine modifications, but rather from the effects of other interventions provided along with them. Therefore, the pure effects of fluid or caffeine intake should be identified by further studies.
Third, the results are based only on short-term outcomes. Most selected studies measure the outcome variables after 4 to 6 weeks from the baseline, except for one [29], which has a 6-month follow-up. Modifying one’s behavior requires time-consuming effort, such as the continuous interest of healthcare professionals and the willingness of people with OAB to continue interventions longer term [48]. Therefore, further studies should identify the long-term effects of fluid and caffeine intake modification.
Finally, overall RoB was high because of missing outcome data. RoB 2.0 generally judges the overall RoB as corresponding to the highest RoB [24]. Three RCTs were at high risk of overall bias because they had high risk in the missing outcome data domain. In this domain, it is first checked whether the data for the outcome is available for all or almost all and participants are randomized. If not, it is examined whether there is evidence for not causing bias due to dropouts and if that depends on the true value [24]. Several studies included in this review had different rates and reasons for dropout data, which may over or underestimate the effects of interventions [49]. For example, Bryant et al. [26] presented the reason for withdrawal, but not a statistical method for how they dealt with the dropout data. Dowd et al. [28] had a 45% dropout rate and included 55% for analysis, which may have caused bias. Swithinbank et al. [32] had 15 dropouts and 69 women completed the study, but there was no reason given for their dropping out. The reason for dropouts should be described, and statistical analysis that can correct this should be used when analyzing data.
In conclusion, this review confirmed the effectiveness of fluid and/or caffeine intake modifications for improving OAB symptoms in adults. Since fluid and caffeine modifications are effective, they can be included in OAB interventions. Further research is necessary to identify the long-term effects and perform further analysis such as meta-analysis.