


INTRODUCTION
More than 300 million women worldwide suffer from urinary incontinence and the prevalence is increasing with the demographic changes in the aging society [1,2]. There is a lack of noninvasive diagnostic methods as well as regenerative therapy options to identify and treat the underlying condition [3]. Current treatment of stress urinary incontinence (SUI) is either conservative (physiotherapy), medicinal or surgical—including bulking agents and implantation of slings or artificial sphincters [4]. All therapies are associated with limited effectiveness or relevant side effects over time and further do not treat the underlying pathophysiological causes of SUI [5]. The regenerative approach is an emerging field, focusing on the repair and replacement of human tissues and organs using stem cells [6,7]. This approach may, for instance, be focused on muscle precursor cells (MPCs) to regenerate and strengthen urinary sphincter function in female patients with SUI [8]. Still, an objective, noninvasive, and easy-to-use method for the measurement of sphincter function before and after regenerative therapy in patients with SUI is desired.
Among modalities used for imaging of lower urinary tract, including multiplanar 3-dimensinal (3D) ultrasound, magnetic resonance imaging (MRI) provides so far the most accurate and detailed assessment of complex pelvic floor anatomy [9]. Due to high spatial and contrast resolutions, as well its precision in distinguishing tissues, MRI has become an imaging modality of choice for suspected pelvic pathologies as well as in the preoperative planning of female patients [10]. Recently, T2-weighted turbo spin echo (TSE) and balanced steady-state free precision (TrueFISP) sequences were proposed for imaging of pelvic floor weakness [11]. Other techniques like diffusion tensor imaging (DTI), allow the assessment of water proton diffusion anisotropy within structured tissues [12]. Although DTI was firstly designed for neuroscientific applications [12-14], it was soon after acknowledged as a clinically applicable method [15] and described in skeletal muscles [16,17]. Feasibility of DTI was also shown for the visualization of the female pelvic floor [18,19] and recently also applied for assessment of superficial muscles of the human perineum [20] or course and directionality of levator ani fibers in females [21]. However, the presented approaches did not include fast assessment of the muscle function. From a physical point of view, biological structures, such as neuronal or muscle fibers, restrict the random (Brownian) motion of the water molecules less along their longitude than in other directions. The most commonly assessed indices are: mean diffusivity (MD) characterizing the average motion of water molecules disregarding the direction, size and integrity of the cell, and fractional anisotropy (FA) describing the anisotropy and thus the structural integrity of cellular structures within the fibers [14].
Hence, our study aimed to: (1) confirm the feasibility of rapid DTI in evaluation of pelvic floor muscle structures; (2) compare the MD and FA parameters, derived from the urinary sphincter and levator ani muscle regions; based on a rapid acquisition of isometric spatial resolution DTI during rest and active contraction of the lower female pelvis.
MATERIALS AND METHODS
Subjects
The study was approved by the local ethics committee (KEKNr. 2015-0081) and included 10 healthy, nulliparous and nulligravid female volunteers of 28 years mean age (21–36 years). All volunteers signed the patients-informed consent to acquisition and subsequent analysis of the magnetic resonance images, and underwent scanning between June and July 2019. Each subject was requested to rate the potential discomfort during the MRI examination.
Scanning Protocol
MRI scanning of the lower pelvis was performed at 3 Tesla (Magnetom Skyra, Siemens Healthcare, Erlangen, Germany) using an 18-channel phased-array receiver body coil. The MRI protocol consisted of T1-weighted TSE and T2-weighted fatsaturated turbo inversion-recovery magnitude sequence for anatomical reference; a single shot trace-weighted echo planar imaging diffusion sequence with phase encoding and simultaneous multislice acceleration for DTI (iPAT=4; for details of the acquisition parameters; Supplementary Table 1 and Supplementary material 1A). Both the anatomical T1-weighted and DTI images were acquired in transverse plane for semiautomatic image realignment, while the T2 sequence was acquired in both transverse and coronal planes for spatial planning during acquisition and as a reference for manual segmentation of periurethral muscles. To ensure repeatability of the assessment and taking into account the comfort of the volunteers, DTIs were acquired in 4 phases: twice during rest (denoted rest-1 and rest-2) and twice during contraction (denoted contraction-1 and contraction-2); for every phase lasting 30 seconds. The acquisition time, reflecting the acceptable time for the patient to keep the contraction, dictated the resolution, acceleration factor, and the number of averages employed (Supplementary Table 1). Every phase was separated by a break pause of 30 seconds during which no MRI acquisition was performed (Fig. 1). To reduce the differences induced by the variable contraction performance, all volunteers underwent a short practice of the lower pelvis muscles contraction as if their aim was to stop the urine outflow during micturition. Additionally, T1-weighted images were acquired twice—before and after DTI—to confirm no change in patient’s position during DTI measurements.
DTI Postprocessing and Analysis
All DTI images were postprocessed and analyzed using Syngo. via Neuro 3D workflow (Siemens Healthcare, Germany; Supplementary material 2). Based on the initial signal analysis and the length of the DTI scanning protocol, no significant and influential diffusion signal drift was assumed so no signal correction was performed.
Regions of Interest Analysis
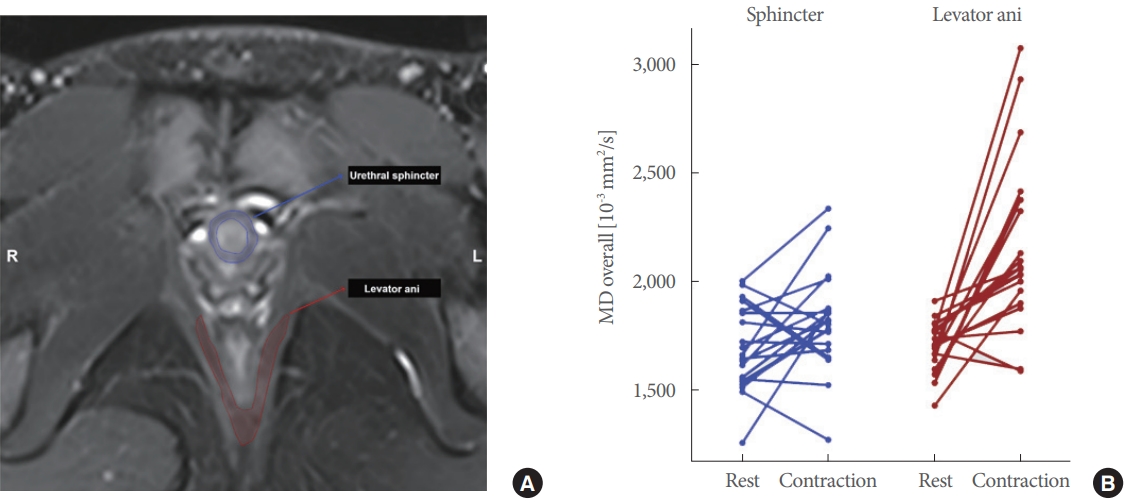
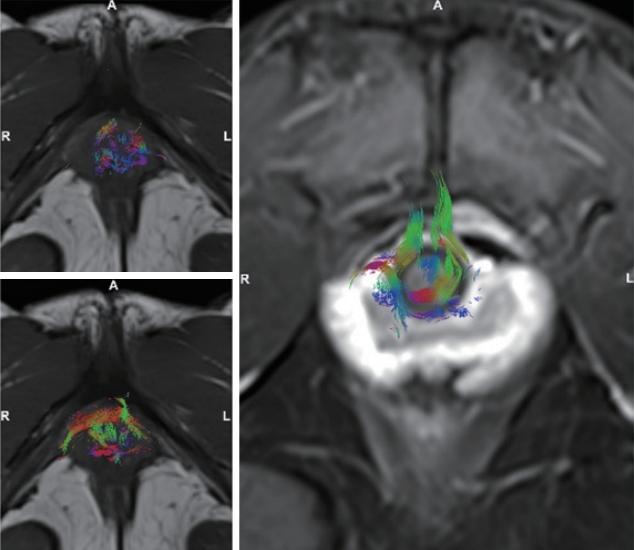
Manual segmentation of the urethral sphincter as well as the levator ani muscle was performed by reader-1 (trained urology resident) and by reader-2 (specialist in uroradiology), independently. For each volunteer, each reader manually placed 3–4 regions of interests (ROIs) in the anatomical reference T1-weighted images. The ROIs were placed within the slices where the urinary sphincter muscle was visible in the midurethral position and covered the area of the periurethral tissue (2–3 ROIs). Additional single ROI was placed in a central position of the levator ani muscle. For DTIs from the resting phase, the position of the sphincter and the levator muscles were confirmed visually in the respective T1- and T2-weighted images. For the contractility phase, the defined ROIs were spatially translated according to the position of the sphincter and adjacent structures in the respective DTI image. For subsequent statistical analysis, mean MD and FA were automatically calculated for the ROIs from each phase of the experiment separately. To further visually confirm the fiber tracts arrangement in the pelvic floor and their insertion into the urinary sphincter muscle based on the set ROIs, a 3D reconstruction of DTI images was performed in Syngo.via Neuro3D workflow from the first resting phase DTI in each subject separately (Fig. 2A, Supplementary material 1B).
Statistical Analysis
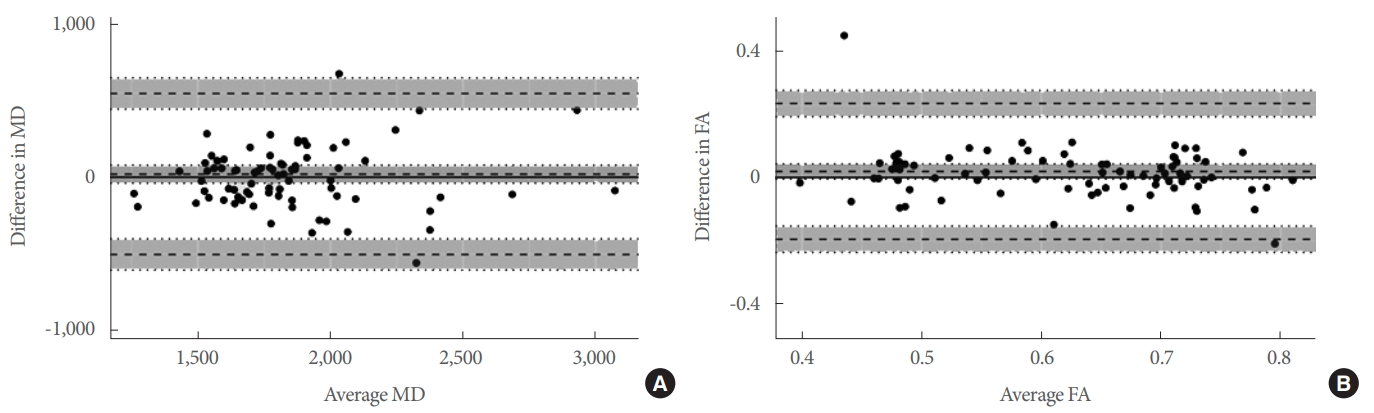
All statistical analyses were performed using R (R Foundation for Statistical Computing, Vienna, Austria - www.R-project.org, accessed December 2019). For each subject, 3–4 mean MD and FA values were calculated from ROIs drawn on maps computed during each phase of the experiment, separately by readers 1 and 2. In total, 78 MD and FA values were measured in 10 healthy volunteers by each independent reader. Subsequent statistical analysis was performed in few steps, for each reader separately. First, Shapiro-Wilk normality test was used to confirm that the MD and FA values—aggregated from all the volunteers—form a nonnormal distribution in every phase of the experiment. For a single subject, average MD and FA were computed based on the mean values obtained from ROIs— jointly as well as separately for the sphincter and the levator ani muscles—for each phase of the experiment. Second, KruskalWallis 1-way analysis of variance (ANOVA) was used to find significant differences in the average MD and FA values, aggregated from all the subjects, between the experiment phases. Subsequent Dunn multiple comparison searched for specific differences between the average MD and FA values among the experiment phases. The results were considered significant for P<0.05 after false discovery rate (FDR) correction. Third, uniformity of the measurements was confirmed by calculating Spearman correlation between the average MD and FA values from 2 rest and 2 contraction phases independently. The results were considered statistically significant, if the correlation exceeded 50% with non-zero slope and P<0.05. The results were presented visually with a whisker-box plots for the average MD and FA values coming from different experiment phases. Finally, intraclass correlation (ICC) comparing the average MD and FA values, from all the experiment phases by 2 independent readers, was calculated along with its 95% confidence interval (CI). Bland-Altman plots were generated to graphically confirm the calculated ICC ranges.
RESULTS
Demographic characteristics of the subjects are presented in Table 1. No concomitant disease or previous obstetric history was reported by any of the female volunteers. All scans were completed and participants did not report any significant discomfort during the MRI acquisitions. No significant motion or other artefacts influencing both qualitative and quantitative assessment of the acquired images were found among all the anatomical and diffusion sequences. A representative 3D DTI reconstruction of urethral sphincter fiber tracts during the ‘rest’ and ‘contraction’ phases for a single subject is shown in the Fig. 3.
MD and FA in the Urethral Sphincter and Levator Ani
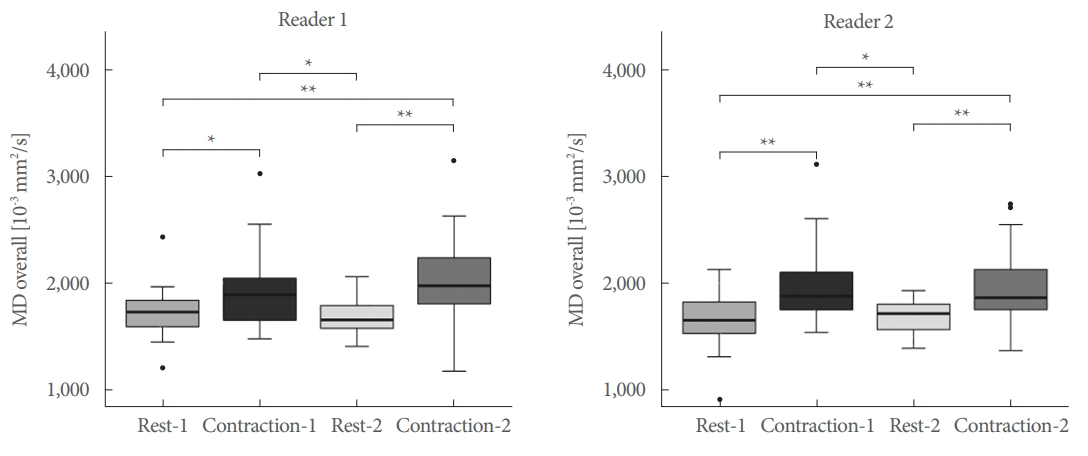
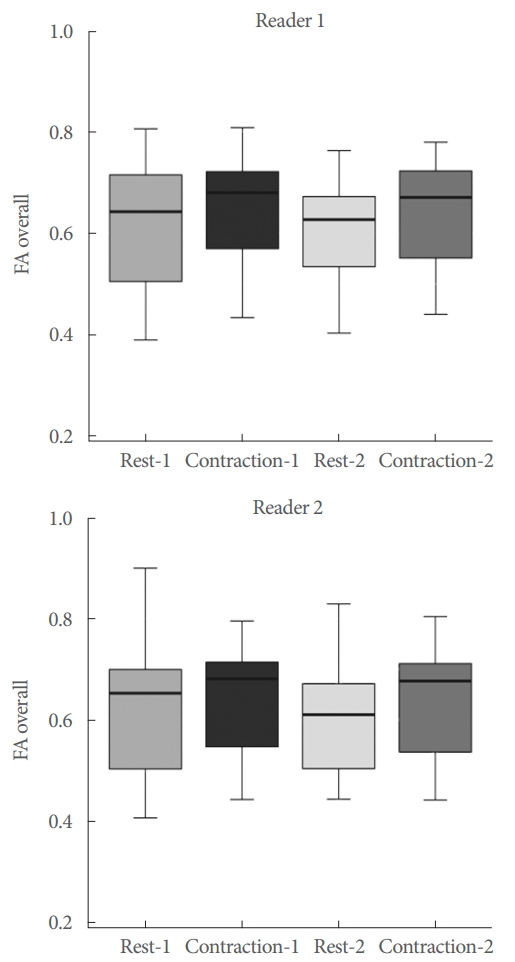
Absolute measured values for MD and FA of both readers are displayed in Supplementary Table 2A and B. A graphical display of the overall difference in mean MD values from ‘rest’ to ‘contraction’ of both readers is plotted in Fig. 2B. Kruskal-Wallis 1-way ANOVA showed statistically significant differences between MD values among all the experiment phases based on the measurements by readers 1 and 2 (X2[3,76] =17.16, P <0.001 and X2[3,76]=15.88, P<0.01, respectively). Dunn multiple comparison revealed statistically significant differences between MD values among the experiment phases: rest-1 vs. contraction-1 (P<0.05; for both readers), rest-1 vs. contraction-2 (P<0.01), rest-2 vs. contraction-1 (P<0.03) and rest-2 vs. contraction-2 (P<0.01 and P<0.02), respectively. No statistically significant differences were found between the MD values from rest-1 vs. rest-2 and contraction-1 vs. contraction-2, by both readers (Fig. 4). Similarly, Kruskal-Wallis 1-way ANOVA did not show statistically significant differences between FA among all the experiment phases, by both readers (Fig. 5).
MD and FA in the Urethral Sphincter and Levator Ani Separately
The analysis of variance between MD values from the sphincter solely revealed no differences between the experiment phases (X2[3,36]=3.91, P=0.27 and X2[3,36]=2.93, P=0.40 for both readers, respectively). However, the comparison between MD values from the levator ani showed statistically significant differences between the experiment phases (X2[3,36] =15.01, P<0.002 and X2[3,36]=14.37, P<0.003). Dunn’s multiple comparison revealed significant differences in MD values between rest-1 vs. contraction-1 (P<0.03 and P<0.02, for both readers), rest-1 vs. contraction-2 (P=0.01 and P<0.001), rest-2 vs. contraction-1 (P<0.03 and P<0.01) and rest-2 vs. contraction-2 (P<0.01 and P<0.001). No statistically significant differences were found between the MD values from rest-1 vs. rest-2 and contraction-1 vs. contraction-2, by both readers.
Correlational Analysis
Spearman correlation between the average MD values was found moderate between the rest-1 and rest-2 phases by both readers (rho =0.61, P <0.01 and rho =0.47, P <0.05 for both readers, respectively). Strong and moderate correlation was found between the contraction-1 and contraction-2 phases by both readers respectively (rho=0.83, P<0.001 and rho=0.45, P<0.05). Similarly, the correlation between FA values from between the rest and contraction phases separately was found as rho =0.75 and rho =0.70 (both P <0.001) by reader 1, and rho=0.80 (P<0.001) and rho=0.65 (P<0.01) by reader 2.
Interreader Agreement
A good to excellent agreement was found between the measurements performed by the 2 readers. Mean ICC for the average values aggregated from all the phases of experiment was 0.85 (95% CI, 0.46–0.99) for MD and 0.79 (95% CI, 0.71–0.99) for FA. Bland-Altman plots showing the agreement between 2 readers in estimation of the average MD as well as FA values are presented in the Fig. 6.
DISCUSSION
In the current study, we confirmed the feasibility of DTI in the evaluation of pelvic floor muscles. To date, previous reports described application of DTI for evaluation of female pelvic floor muscles [18-20,22] as well as in the internal and external urinary sphincter muscles in healthy males [23]. However, to our knowledge, we are the first to investigate application of DTI acquired in 30-second frames for isometric resolution of 3×3×3 mm3. Furthermore, we assessed DTI metrics derived from the urinary sphincter and levator ani muscles during 2 contradictory states (rest and contraction) in 10 healthy female volunteers. By evaluation of 2 independent readers, we have found the average MD parameters changing between the rest and contraction in the urinary sphincter and levator ani muscles, when assessed jointly. No change in FA was, however, observed between the rest and contraction phases. It is also worth highlighting, that the major changes in MD were observed in the majority in levator ani muscle regions, by both readers. Overall, the average MD among the healthy female volunteers was significantly higher during both contractions, compared to both resting phases (ΔMD=20.6% increase). At the same time, no change was observed between rest-1 vs. rest-2 and contraction-1 vs. contraction-2 phases for both MD and FA, and a moderate to high correlation was found between the compared phases by 2 independent readers. The obtained results were supported by high ICC between a trained urology resident and a specialist in uroradiology (0.85 for MD and 0.79 for FA).
We believe that DTI might become a supportive diagnostic imaging tool for the evaluation of muscle training state, pelvic floor function and maybe even tracking of implanted MPCs. This is supported by a physical perspective, where DTI provides both quantitative and qualitative assessment of microstructure and physiological processes ongoing in the macroscopic muscle architecture [14]. In the muscle fibers, the diffusivity of water is larger in the direction parallel to dominant muscle fibers. Since MD expresses the average and FA the largest directionality of water molecules in random motion, the muscle architecture and function can be assessed indirectly [20,24,25]. As we observed an increase in MD during contraction of pelvic muscles, the effect might have been caused by higher uniformity of the muscle orientation compared to that during rest. Further, during contraction the length of sarcomeres is being reduced and muscle fiber diameter increases with the reduction in intermyocital space. This may lead to a relative increase in measurable MD [25]. Significant change in both MD and FA values was also found between passive shortening and elongation of human calf muscles [26]. However, the investigated volumes of the muscle structures were much larger and of different spatial structure compared to the urinary sphincter or levator ani muscle.
Thus, our findings are affected by a few limitations. First, the limited statistical power presented was connected with acquisition in only 10 young healthy volunteers. Hence, we applied a nonparametric approach along with correction for FDR due to both the log-normal character of the assessed data as well as the manual tissue segmentation applied. In the other studies, DTI of the female pelvic floor and the male urethra or the visualization of periprostatic nerval tracts were also described in 5–11 volunteers with an acquisition time of 4–18 minutes [18,20,22,23]. Additionally, alterations in proton diffusivity of muscle during extension and contraction were also demonstrated [25]. In further research, we aim to perform measurements in larger cohorts as well as to compare them to patients with functional pelvic disorders. Second, to shorten the acquisition during contraction phases, we have performed DTI in only 6 directions with 2 b-values (0 and 400 sec/mm2) measured with no increase in the number of averages. This provided a suboptimal signal-to-noise ratio for DTI measurements [27,28]. Although this prospectively resulted in residual bias during calculation of MD and FA parameters, we were able to acquire a single DTI image in a rapid time of 30 seconds only. It is worth highlighting, that this assured higher repeatability of the contraction performed by the volunteers along with the break periods between each DTI acquisition and stability of physiological response to the muscle action. The acquisition of higher resolution DTI with an increased number of averages, diffusion directions, or reduced acceleration factor would be desired for accuracy of the measurements as shown by other authors [18,21]. However, such protocol would not be useful in applications with focus on functional aspects due to the long scanning time—especially in patients with SUI. Third, the limitations of applied DTI preclude an isolated statement about the urinary sphincter. Since this is a small anatomical structure, the measurements of contractions rely on a few pixels only. Obviously, high-resolution DTI would bring more information, but its application is not feasible due to time constraints during contraction. Therefore, we would potentially be able to increase differentiation by reducing the noise influence with extended acquisition during the rest. The other possibility, was to choose a surrogate muscle structure continence, such as the levator ani, to receive reliability and reproducibility within a larger anatomical region. By applying the latter approach, we found MD and FA parameters to provide sufficient information for a fast clinical DTI assessment. On the contrary, potential findings in patients with SUI may provide lower differentiation between rest and contraction based on the evaluation in urethral sphincter solely. Last, MRI has its limitations in patients with claustrophobia. Therefore, results could be relevantly influenced (i.e., anxiety), altered (i.e., elevated muscle tonus) or the examination not be performed in some individuals. However, many comforting strategies have been implemented, such as the use of ear-plugs or headphones with soothing music, soft blankets, convenient positioning, adjusting of ventilator, shortening of acquisition time, and vocal contact to the examiners with the possibility of ending the investigation via emergency button at any given moment.
In conclusion, our findings demonstrate that rapid DTI acquisition may serve as a supportive noninvasive tool for the assessment of urinary sphincter and levator ani muscle integrity and contractility in healthy female volunteers. Despite the short acquisition in isometric 3×3×3-mm3 resolution, our DTI protocol allows differentiating between the rest and contraction of the pelvic floor muscles. Rapid DTI-based strategy is promising, may improve fast assessment of the urinary sphincter function, and bring additional value for the diagnosis as well as the follow-up of patients suffering from SUI.