


INTRODUCTION
The need for research into factors that affect the precise administration of prescriptions and poor patient persistence were reported more than 10 years ago [1]. Although the call for such research continues to be made [2], the issue of compliance with drug treatment for lower urinary tract symptoms (LUTS) patients remains quite pressing. [3]. Overactive detrusor symptoms have an adverse impact on health-related quality of life. This frequently occurs in the form of decreased physical, mental, and sexual activity; depression and lower self-esteem; and sleep deterioration [4], as well as the bothersome urge to urinate; incontinence episodes; and the necessity to constantly stay near a restroom and use sanitary towels [5]. LUTS symptoms are accompanied by significant direct and indirect economic costs, including a decrease in productivity [6]. The literature provides evidence that in the United States (US), the direct costs of diagnosis and treatment of LUTS were $22.3 billion in 2009 and were the highest among the working population under 65. Thus, the main financial burden associated with the lower urinary tract falls on the working population [7]. The expected costs of treatment of overactive bladder (OAB) and of LUTS in general among the working population reach $82.6 billion in the US alone. During the investigation it was found that they are prepared to bear considerable costs of treatment to reduce the frequency of urges to urinate and urinary incontinence episodes because LUTS was reducing their work productivity and, ultimately, the competitiveness of the labor market [8]. Patients’ treatment compliance is no doubt related to efficacy and safety of antimuscarinic (AM) drugs, as well as their dosage regimens and side effect. These properties and their impact on patients’ persistence have been examined in the literature [9].
However, these factors are far from being the only ones that determine a patient’s compliance with a drug regimen. For example, Kleinman et al. [10] concluded that the ability to pay for drugs has a direct impact on patients’ persistence and ensures the economic benefits of executing a doctor’s prescriptions for both the employer and employee. Data have been published on the costs of short-term and long-term disability, compensation to employees, and the frequency of changing employers as associated with the inability to perform work duties. These data demonstrate the importance of understanding the causes of low efficacy of treatment for employed persons and the need for additional efforts to remedy the situation.
The same group of authors [10] and another research group [6] have examined the fact that the treatment compliance in working and non-working individuals may be different due to differences in their social, economic, and psychological status. Knowledge of these features, increase the treatment efficacy and reduce the economic costs of OAB treatment. Yet, as the researchers admitted, the significant limitations of their study include the absence of analysis of impact of various compliance factors in regard to particular AM drugs. They also expressed confidence that multifactorial studies would be appropriate for addressing adherence in the treatment of OAB.
One of the most frequently used AMs to treat OAB symptoms is solifenacin. High efficacy of solifenacin related to the impact on M3-receptors of the urinary bladder [11]. The low level of side effects is related to the fact that the drug’s selectivity to bladder receptors is 3.6 times higher than selectivity to salivary glands and significantly exceeds the selectivity of other AM drugs [12]. However, an exhaustive search of the English-language research literature yielded no studies regarding the complex influence of various factors on adherence to solifenacin treatment.
In our previous studies we found that adult men and women adhere poorly to prescriptions for solifenacin during OAB treatment in the polyclinic [13-15]. Many of our have faced medical and non-medical factors that prevented them from implementing the recommendations. Thus, the purpose of this study is to analyze the possible impact of the wide range of social, economic and medical factors on compliance with solifenacin treatment in working population. The working hypothesis of this study was that analysis, comparison, and classification of various factors that affect treatment compliance in working people could enable singling out those factors that significantly affect behavior related to treatment compliance among patients who suffer from OAB.
MATERIALS AND METHODS
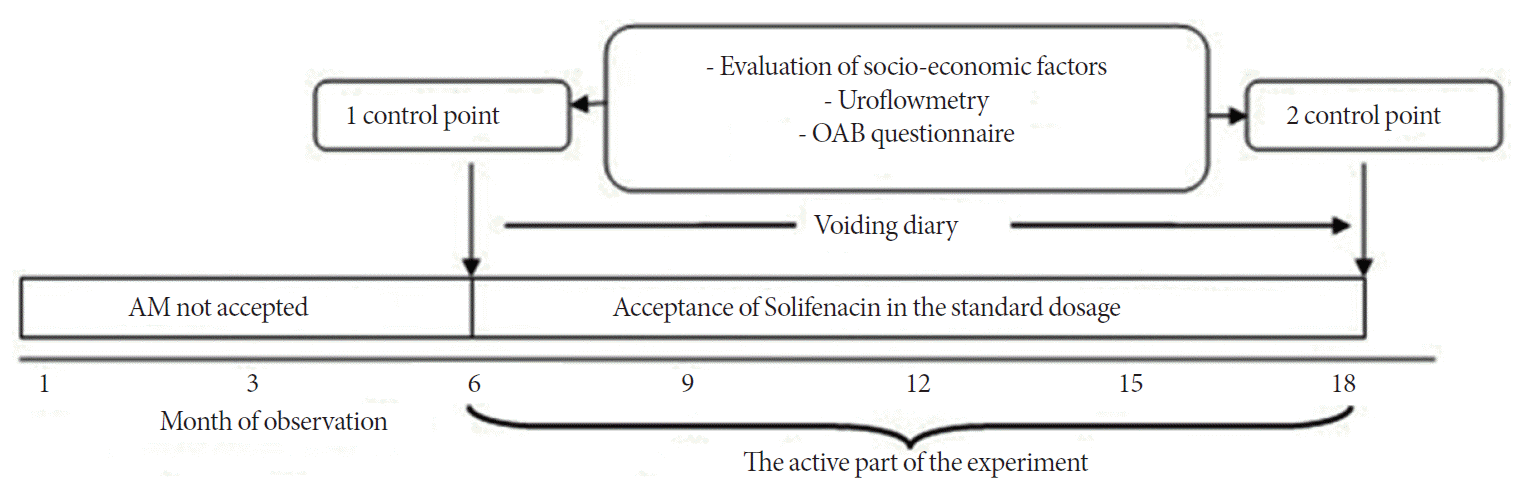
A randomized study of factors that affect compliance with solifenacin treatment was carried out at Primorsky Regional Diagnostics Center and Vladivostok Municipal Hospital #3 from January 1, 2012 to January 3, 2014. In the first stage, working patients aged 18 to 60 were selected: men and women who had been prescribed solifenacin long-term and met inclusion and exclusion criteria. When calculating the volume of the sampling population, the confidence probability and confidence interval were taken at 95%. The study design is shown in Fig. 1.
The stratified (layer-by-layer) randomization that provides equal gender representation within groups was used. In the group were enlisted persons who have been assigned long-term intake of solifenacin. Enrollment was carried out on odd days of the week. After the experiment the patients were divided into 3 groups in accordance with the level of compliance: compliant employees (ie, those with compliance of ≥80%), poorly compliant employees (i.e., those with compliance of <80% yet ≥50%) and noncompliant employees (i.e., those with compliance of <50%) [8]. The last group was considered the control.
To estimate treatment compliance, workers who had been prescribed solifenacin as monotherapy for treating overactive bladder - OAB (International Classification of Diseases, 10th Revision, Clinical Modification [ICD-10-CM] N32.81), urge incontinence - UI (ICD-10-CM N39.41), mixed incontinence - MI (ICD-10-CM N39.46), or nocturia (ICD-10-CM R35.1) [16] were studied. Patients whose diagnosis was confirmed by the overactive bladder questionnaire (OAB-q) and uroflowmetry were included [17]. After allocation into groups, the patients were monitored for 12 months. All patients who had been included into the experiment kept bladder diaries during this period to record daily data regarding the number of times they urinated, urgency episodes and incontinence episodes, and side effects [18]. To estimate therapy efficacy before and after the active part of the experiment (see Fig. 1), patients were repeatedly subjected to uroflowmetry and were asked to fill out the OAB-q. At the beginning and end of this study, all study subjects filled out surveys that gathered information about their demographic characteristics and economic status, and submitted information from their employers and tax records (abstract from work record book and statement of income of a physical person). Additional criteria for inclusion in the study were employment of no less than 6 months prior to the beginning of the study period, and holding a mandatory medical insurance policy. Descriptive variables that were noted for the study subjects included age, gender, family status, level of education, and number of first-generation descendants (children). Economic factors considered included annual salary, average salary, duration of previous employment by a single employer, full/part-time status, multiple employment, percentage of monthly expenditures for solifenacin as a share of salary, and percentage of drug expenditures overall. The level of income and expenditures were adjusted for inflation against the US dollar as of January 2012. The rate of personnel turnover was defined as a percentage of employees in each group who resigned from their primary job within the 12-month monitoring period. The type and severity of urination disorders, presence of side effects caused by solifenacin, treatment efficacy, and presence of coexisting diseases were classified as medical factors that were assumed to directly affect treatment compliance [19-21]. The simultaneous administration of several drugs, the patient’s awareness of OAB treatments, previous experience of AM treatments, and adherence to a rational treatment sleep-wake cycle were analyzed as medical factors that could possibly affect the compliance level.
In this study, patients’ treatment compliance was calculated as the time between commencement of solifenacin intake and a treatment-free period of 30 days or more according to self-report [8]. Persistence was calculated for each type of urination disorder (OAB, UI, MI, nocturia), as well as for urination disorders of various severity levels. The value of episodes of urinary urge incontinence (EUI) was taken as the criterion for the severity of lower urinary tract disorders. A urination disorder accompanied by an EUI score of more than 21 per week (or 3 per day) was considered severe [22-24].
Drug treatment compliance was defined as the percentage of days during a year starting from the commencement of solifenacin intake, during which the patient took the drug in accordance with the prescription. Compliance was estimated on the basis of data of bladder diaries in which the patients kept records regarding prescriptions as instructed.
To study survivorship, which is a property of treatment compliance, we used the model of a treatment-free period of 30 days or more.
The compliance level was determined using a model of the 30-day treatment break (≥30 days) [8]. When analyzing compliance, a 2-parameter Weibull distribution with estimation of the maximum likelihood by standard iterative methods of function minimization and first-type multiple right censoring was used. To estimate the significance of the relationship of social, economic, and medical factors to treatment compliance, models with a gamma distribution and a log link function were used, as detailed in Table 1.
The significance of differences in parameters between groups was also controlled using a regression model. Modelling the significance level for such parameters was carried out separately for employees of the 3 compliance levels (more or less than 80%, less than 50%). Differences were considered to be significant when P<0.05, with all P-values being 2-sided. All statistical analyses were performed using SAS ver. 8.0.2 (SAS Institute Inc., Cary, NC, USA).
This study has been carried out in accordance with the principles of the Declaration of Helsinki. Written informed consent was collected from all study participants. The study design has been approved by the Ethics Committee of Far Eastern Federal University (#72/004/15).
RESULTS
In accordance with the exclusion criteria, 1,038 men and women experiencing various forms of LUT dysfunction were selected. All of them were prescribed a standard dosage of solifenacin (10 mg per day) once a day on daily basis for a year by an attending physician. Using the model of waiting for a 30-day and longer treatment break, we determined that the mean time to reach a 30-day treatment-free period for solifenacin in the study subjects was 147 days. Among the patients, 49% complied with treatment for 6 months, 42% for 9 months, and 32% for the entire 12 months.
Table 1 shows descriptive properties, as well as demographic, social, and clinical values obtained during the analysis of patients of different treatment compliance levels. Compliance level was determined as low, (<50%; n =191), medium (≥50% <80%; n=481), or high (≥80%; n=366). The average age of persons with a high compliance level turned out to be significantly higher than that of persons with low (P≤0.01) or medium (P≤0.05) compliance. The percentage of persons who were working in the fields of medicine and education turned out to be substantially higher in the group of patients with a high compliance level (P≤0.01, P≤0.01). Annual and monthly incomes of people with a high compliance level were significantly higher than those of persons with medium or poor compliance (P≤0.05, P≤0.01). Besides, the percentage of Solifenacin purchase expenditures among these persons was substantially lower than that in other groups (P≤0.05). The study of Solifenacin treatment compliance level in people who suffer from various forms of LUTS enabled to reveal the following conformity. Significant dominance of the share of patients with a high compliance level was revealed in people who suffer from urge UI (P≤0.05, P≤0.01). The percentage of persons with poor compliance also turned out to be low. Similar conformity was also reported when analyzing the distribution of persons with severe urine incontinence symptoms by compliance groups. Poor treatment compliance was reported only in 7% of persons who suffer from severe LUTS symptoms. At the same time, the share of persons with a high compliance level was 55.3% (P1/2≤0.01), while the percentage of persons with a medium compliance level was 37.7% (P1/2≤0.05; P1/3≤0.05). Subjective treatment satisfaction was attained by 80.3% of persons with the highest level of treatment compliance (P≤0.05, P≤0.01). The same group turned out to have the largest number of persons whose objective values of the functional condition of the lower urinary tract substantially improved. An unsatisfied experience of other antimuscarinic drug treatments was shared by most patients with a low level of treatment compliance. The analysis of the relationship of bad habits in patients led to the discovery that the prevalence of caffeine abuse is more specific to persons with a low level of treatment compliance (38.7%). Approximately every one in ten persons of the high compliance group was abusing caffeine.
When estimating such criteria as daytime frequency, night frequency, and urge incontinence, the number of points scored by patients with a high compliance level after the treatment course was significantly smaller than that of patients in the other groups (P≤0.05 for all cases) (Table 2). The differences in these values before and after treatment among patients with a high compliance level were also significant. Patients were frequently bothered by dry mouth; the total number of reported cases was 173 (16.7%).
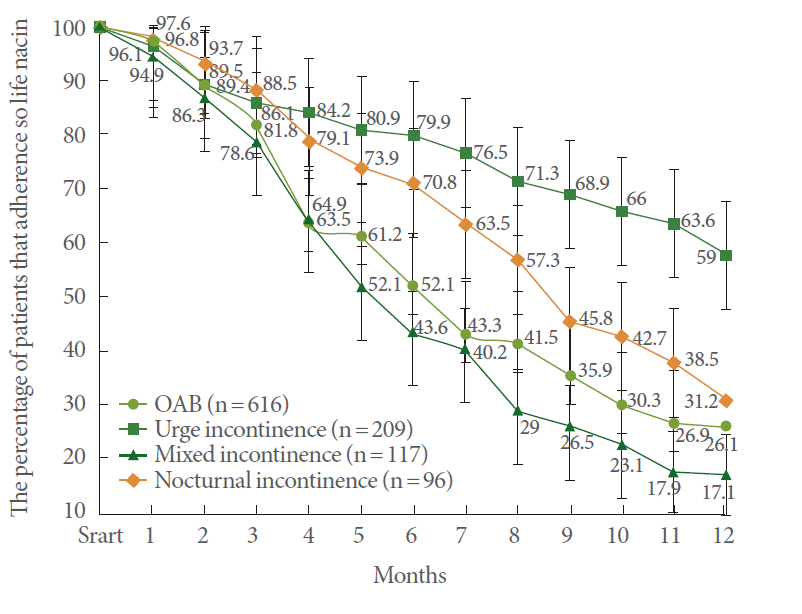
The highest compliance level was shown by urge urination incontinence (UUI) patients, yet significant differences between patients experiencing other forms of LUT dysfunction had been reported only by the ninth month of monitoring (Fig. 2, 3).
The impact of side effects on the compliance with solifenacin treatment is shown in Fig. 4. Subjects with side effects who described them as “substantial” had discontinued the treatment by the third or fourth month of the experiment. The correlation of curves that describe the decrease in the number of patients who continued treatment while having 1, 2, or more side effects was r=0.92, P≤0.05. Significant differences in this value were reported in the second quarter: women’s compliance turned out to be relatively higher than that of men (P≤0.05).
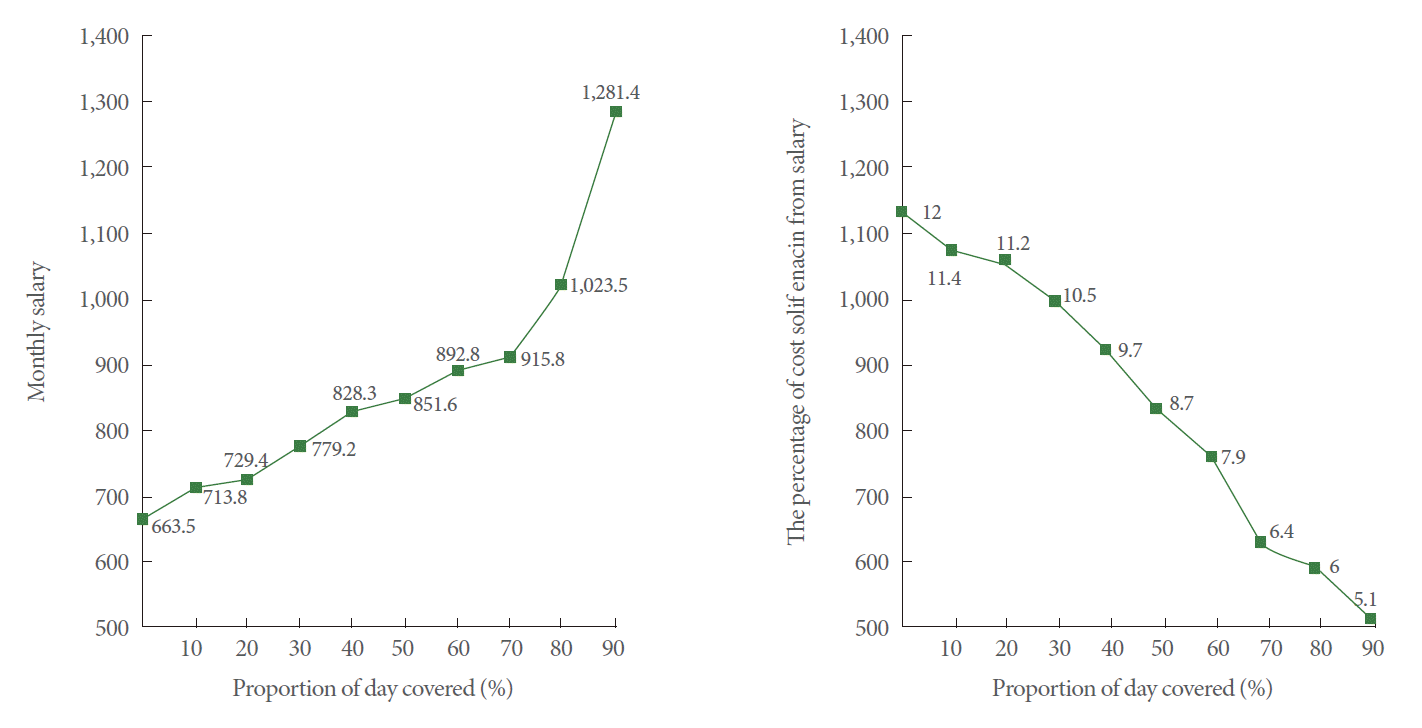
In the regression model, the impact of salaries and their squares turned out to be statistically significant (P≤0.05, P≤0.05). It was noted that the high degree of dependence regarding the impact of the percentage of the salary has been spent on solifenacin purchase and the square of such percentage (P≤0.05) (Fig. 5).
Thus, we discovered relationships between age (P≤0.01), type of labor activity (P≤0.01, P≤0.01), type of LUT dysfunction (P≤0.01), severity of symptoms (P≤0.01), treatment satisfaction (P≤0.01), treatment efficacy (P≤0.01), lack of satisfaction with AM intake (P≤0.01), and caffeine abuse (P≤0.01) and treatment compliance among people with a compliance level of ≥80%.
DISCUSSION
In this study we found that in the group of persons who were adherent to treatment of solifenacin of ≥80%, the proportion of patients of senior age, those working in education or medicine, those with a relatively high income, as well as those with a low percentage of the salary spent purchasing solifenacin were significantly more common than in groups of lower compliance. We also found that in study subjects with the highest level of treatment compliance, the percentages of patients with UUI and severe symptoms of urinary incontinence those satisfied with effect of solifenacin intake, and those not satisfied with other AM treatments were significantly higher. Objectively measured treatment efficacy in the group with a compliance level of ≥80% was significantly higher than that in other groups. The number of caffeine abusers in this group was also small. It was determined that the number of severe side effects, as well as severity of LUT dysfunction, had an adverse relationship with compliance. Regression models based on the data gathered show the relationship of salary level, its square, as well as the percentage of the salary spent on purchasing solifenacin and its square to treatment compliance. In addition, the association of a number of social factors (profession, age, rational nutrition) with the duration of continuous solifenacin intake among people in the group with compliance of ≥80% was noted.
Studies on AM treatment compliance have been carried out before, yet we were unable to find any attempts to study the impact of such a broad combination of factors on compliance with solifenacin treatment among working persons in the available literature. Basra et al. [9] argue that it is solifenacin that, due to its pharmacological properties, has a rapid and stable positive effect on OAB symptoms, which leads to the increase in compliance with prescriptions Sicras-Mainar et al. [2] consider the pharmacological properties of drugs to be the most important factors related to compliance and provide data showing that during 52 weeks, 31.2% of their study subjects maintained their compliance with solifenacin treatment. Having carried out a study in a large group of patients, Chancellor et al. [25] discovered that during a 2-year period, 91.7% of patients failed a compliance test for various AM drugs, and the differences between drugs turned out to be insignificant. D’Souza et al. [26] noted that a high level of inconsistency in the intake of solifenacin and other AM drugs is related to their dosage regimen. In particular, they noted that when using it over the long-term, AM indicated a higher percentage of treatment compliance. Thus, our results confirm the findings of most other researchers regarding the substantial impact of the pharmacological properties of AM and, particularly, solifenacin on the treatment compliance level. However, we were unable to find information in the literature on the relationship between compliance with solifenacin treatment and severity of LUT symptoms, side effects, the type of lower urinary tract dysfunction, or satisfaction with therapy. We were able to address these questions in our study.
We have also revealed the relationship between compliance with solifenacin treatment and patient age, and occupation, and eating behavior (not caffeine abuse). Elderly people are more committed to strict compliance with the doctor’s recommendations, which probably can be explained by a significant severity of symptoms characteristic of this age, increased opportunities to pay for expensive medicines, as well as the presence of a large amount of free time. The relatively large percentage of people working in education and health care probably can be attributed to their more rational approach to their health. Perhaps the people working in these areas are more aware of their disease, allowing a more responsible approach to the implementation of recommendations of the doctor. Similar findings regarding the impact of patient age on compliance were reported by Wagg et al. [27]. However, contrary our study, these authors did not classify the compliance level of different cohorts.
According to our data, such economic factors as income level and percentage of salary spent on purchasing solifenacin are also important for compliance. Kleinman et al. [10] also present data regarding the impact of ability to pay for AM drugs and the percentage of salary spent on AM on the duration of continuous drug intake. However, their retrospective study does not contain information about particular AM drugs and as a control tool uses data from written recipes, which may be greatly different from the amount of AM actually taken. Data regarding actual drug intake obtained from patients themselves are not provided, as recognized by the authors. The findings of Campbell et al. [28] regarding lower compliance with higher expenditures and that of Sears et al. [29] and Harpe et al. [30] regarding higher treatment compliance when free AM drugs are available also accord well with our data.
This study has a number of limitations. We have not studied factors that promote compliance before and during some period after the start of therapy. When controlling for the severity of patient condition, we did not use cystometry and used only uroflowmetry, special questionnaires and bladder diaries, which might have caused some inaccuracy in the estimation of urodynamic values. Nevertheless, the data uroflowmetry (Qaver, Qmax), data diaries of urination and the OAB-SF questionnaire, obtained at the start and finish of the active phase of the study (Daytime frequency, Night frequency, Urgency, Urge incontinence), and presented in the Table 2, are the standard control of the functional state of the lower urinary tract. These data reliably control the dynamics of the objective state of the LUT and compare it with the subjective assessment of their condition by the patients themselves. We have not considered additional expenditures of patients, or the income and expenditures, including unforeseen ones, of their families. We have also not carried out comparative analysis of treatment compliance in regard to other AM drugs, including drugs with a prolonged effect. All these issues can be addressed in future studies.
This study has shown that the level of compliance with solifenacin treatment can be partially attributed to a number of important medical, social, and economic factors. A type of urination disorder, severity of urinary incontinence symptoms, presence of side effects, treatment efficacy, patient satisfaction with treatment, and experience of other AM treatments is closely correlated with the level of commitment of solifenacin treatment. (These factors had significantly greater in patients with a high level of commitment.) Among social and economic factors, those with a strong relationship were patient age, work in medicine or education, annual income level, percentage of expenditures for purchasing solifenacin, and caffeine abuse. Factors with a weaker relationship were gender, work in the transportation industry, and monthly income level. In our opinion, the information obtained may be helpful in forecasting the behavior of patients from different social groups with different levels of income and education, different ages, and varying severity of the symptoms of overactive bladder. Understanding this information will allow the urologist a more rational approach to the choice of the drug, and possibly organize additional monitoring in patients at high-risk for rejection of solifenacin treatment.
In conclusion, this study demonstrated the possibility of predicting solifenacin treatment compliance and improving treatment efficacy by addressing social, economic, and medical factors for employed patients with LUTS.