


INTRODUCTION
The International Prostate Symptom Score (IPSS) is a useful questionnaire to evaluate lower urinary tract symptoms (LUTS) and benign prostatic hyperplasia (BPH). The IPSS is particularly useful in longitudinal follow-up assessments of changes in symptom severity and the evaluation of treatment efficacy [1,2,3]. Therefore, guidelines recommend that the IPSS questionnaire be used as a mandatory test in the evaluation and follow-up of LUTS and BPH [4].
The prevalence of BPH is increasing significantly in the 50s age group [5]. Furthermore, the majority of BPH patients are men aged 60.80 years with weak eyesight and/or impaired cognitive function [5]. Therefore, patients often have to consult medical specialists for assistance with the questions when filling in the IPSS questionnaire [1]. This could introduce a bias in the patients' responses [1].
An alternative scoring system, the Visual Prostate Symptom Score (VPSS), has recently been developed, and may provide a solution to this problem [1]. The VPSS consists of four schematic and intuitive questions that assess the urinary stream, urinary frequency, nocturia, and quality of life (QoL) (Supplementary material). With its simplicity and ease of understanding, VPSS has an advantage over IPSS in assessing LUTS, especially in older patients. African studies on LUTS and urethral stricture have demonstrated that VPSS correlates significantly with IPSS, and can be completed without assistance by a greater proportion of patients [1,6]. There is, however, limited data available regarding the applicability of VPSS in different cultural and study groups. Furthermore, no studies have assessed the utility of VPSS in the longitudinal follow-up assessment of changes in symptom severity and evaluation of treatment efficacy. This study was therefore conducted to compare the IPSS and VPSS systems in Korean patients, in terms of the initial evaluation of LUTS and BPH, and the assessment of changes in symptom severity before and after medication.
MATERIALS AND METHODS
Patients
The Institutional Review Board of the National Police Hospital approved this prospective study. Data were collected prospectively from 240 male patients diagnosed with LUTS, who visited the National Police Hospital more than twice during a 6-month period, starting in July 2013. Patients who had visited the hospital before this period were excluded from the study.
LUTS Assessment
Attending physicians collected medical histories from the enrolled patients. On their initial visit, respondents were issued IPSS (Korean version) and VPSS questionnaires to evaluate urinary symptoms. The sum of IPSS questions 2, 4, and 7 related to irritative symptoms; and the sum of IPSS questions 1, 3, 5, and 6 related to obstructive symptoms. Likewise, the sum of VPSS questions 1 and 2 related to irritative symptoms, and VPSS question 3 related to VPSS obstructive symptoms.
Total prostate volume was calculated using transrectal ultrasonography (UltraView 800, BK Medical, Herlev, Denmark), and the prostate was examined using digital rectal examination. The maximal flow rate, mean flow rate (Medtronic Inc., Minneapolis, MN, USA), and postvoid residual urine volume (UltraView 800) were also assessed. The serum prostate-specific antigen level was measured.
All patients were asked to return for a follow-up visit after 1-2 months of treatment. Patients were issued another IPSS and VPSS questionnaire at the follow-up examination, to evaluate changes in symptoms.
Statistical Analysis
The number of VPSS and IPSS questionnaires completed unassisted was calculated and comparatively analyzed using a chi-square test. The 240 male subjects were then analyzed to evaluate the relationship between VPSS and IPSS using Spearman correlation tests. The relationship between IPSS obstructive symptoms and VPSS obstructive symptoms in terms of maximal flow rate and mean flow rate were analyzed, again using Spearman correlation tests. Another Spearman correlation test was used to elucidate the relationship between VPSS and IPSS in terms of symptom severity before and after medication. Finally, the ratio of the maximal flow rate <15 mL/sec and VPSS obstructive symptoms was calculated, and trends was analyzed using the Mantel-Haenszel test.
Statistical analyses were performed using the SPSS ver. 11.0 (SPSS Inc., Chicago, IL, USA). Observations with a P<0.05 were considered statistically significant.
RESULTS
Patient Characteristics
Patient characteristics for this study population are included in Table 1. The median age was 59.0 years, and median total prostate volume was 28.0 mL. The median total IPSS score was 12, and median total VPSS score was 9. The IPSS questionnaire was completed by 187/240 men (77.9%) without assistance, and the VPSS questionnaire by 219/240 men (91.3%; P<0.05).
Correlations Between the VPSS and IPSS Assessed at the Initial Visit
Findings of statistical analyses are included in Table 2. These assessments revealed a significant correlation between total VPSS and total IPSS. A significant correlation was also found between VPSS irritative symptoms and IPSS irritative symptoms, as well as VPSS obstructive symptoms and IPSS obstructive symptoms. Furthermore, QoL, as assessed by VPSS, showed a strong and significant correlation with IPSS QoL.
Correlations Between Urinary Flow Rate and IPSS/VPSS Obstructive Symptom Subscores Determined at the Initial Visit
There were significant correlations between the maximal urinary flow rate and IPSS/VPSS obstructive symptoms (Table 3). There were also significant correlations between the mean flow rate and IPSS/VPSS obstructive symptoms.
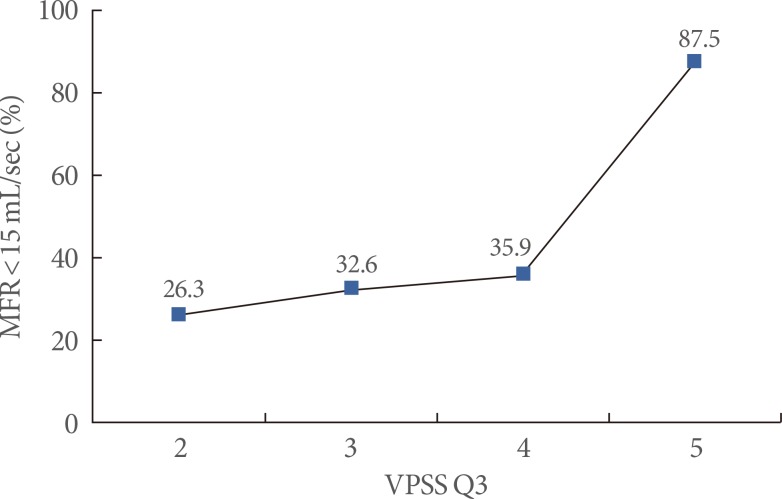
The severity of VPSS obstructive symptoms was significantly associated with a maximal flow rate of <15 mL/sec. There was a significant increase in the ratio of the maximal flow rate <15 mL/sec to VPSS obstructive symptoms as the severity of VPSS obstructive symptoms increased (Fig. 1).
Correlations Between Changes in VPSS and IPSS Assessed After Treatment
The change in total IPSS after treatment significantly correlated with the change in total VPSS after treatment (Table 4). There was also a demonstrable relationship between changes in VPSS obstructive symptoms, irritative symptoms, and QoL and changes in IPSS obstructive symptoms, irritative symptoms, and QoL, respectively.
DISCUSSION
In this study, we attempted to evaluate the relationship between VPSS and IPSS in a previously unexamined cultural and study group. Furthermore, we attempted to compare changes in IPSS and VPSS after treatment. Our data suggest that in the Korean population, VPSS significantly correlates with IPSS. The fact that a change in VPSS also significantly correlates with a change in IPSS after treatment, demonstrates the equivalence of these two systems in terms of clinical utility.
An earlier study [1] that enrolled 96 men with LUTS, has shown a significant correlation between total VPSS and total IPSS (correlation coefficient=0.6227, P<0.001), as well as VPSS QoL and IPSS QoL (correlation coefficient=0.6810, P<0.001). Another study [6] that recruited 100 men with urethral strictures, also demonstrated a correlation between total VPSS and total IPSS (correlation coefficient=0.845, P<0.001). Our study also revealed a significant correlation between total VPSS and total IPSS, and between VPSS QoL and IPSS QoL, and thus supports these earlier findings. Furthermore, the correlation coefficient determined in this study was similar to that of a previous study conducted using LUTS patients. Additionally, obstructive symptoms and irritative symptoms evaluated using VPSS correlated well with assessments made using IPSS in this study. Clinical data concerning the relationship between the obstructive symptoms and irritative symptoms of VPSS and those of IPSS have been examined in two earlier studies. Similarities between findings made in the current study and those reported earlier suggest that VPPS correlates well with IPSS, regardless of cultural group.
The relationship between the obstructive symptoms of VPSS and the maximal flow rate has also been studied previously, although not in a Korean population. A previous study that enrolled patients with LUTS, showed that VPSS obstructive symptoms significantly correlated with the maximal flow rate (correlation coefficient=-0.3696, P=0.003) [1]. Other data concerning urethral stricture have indicated a significant relationship (correlation coefficient=-0.595, P<0.001) [6]. Our results are consistent with the aforementioned data. Additionally, in our study, there was a significant increase in the ratio of the maximal flow rate <15 mL/sec to VPSS obstructive symptoms as the severity of VPSS obstructive symptoms increased. This suggests that VPSS obstructive symptoms may be a predictor of maximal flow rates <15 mL/sec, which in turn indicate bladder outlet obstruction.
To our knowledge, this is the first study to evaluate the relationship between changes in the VPSS and changes in the IPSS after treatment. Our data demonstrated that the change in VPSS after treatment significantly correlated with the change in IPSS after treatment. These results suggest that the VPSS would be useful in evaluating treatment efficacy, not just in the initial evaluation of LUTS. However, the correlation coefficient of the relationship between change in VPSS after treatment and change in IPSS after treatment is lower than the correlation coefficient of the relationship between VPSS and IPSS at initial visit. Therefore, careful interpretation of the VPSS will be needed if it is used to monitor treatment efficacy. Follow-up studies may be required to support these results.
In this study, a larger number of respondents completed the VPSS questionnaire compared with the number that completed the IPSS questionnaire unassisted. Our data confirmed the results of earlier studies [1,6]. The VPSS may thus have potential advantages over the IPSS, in that it can be seen and understood easily due to the inclusion of schematics and intuitive questions. These points might explain the differences in the number of VPSS and IPSS questionnaires completed without any assistance.
Several limitations of the present study warrant mention. Firstly, as this study included data from a single institution, a potential selection bias may have occurred. Secondly, comparisons between VPSS and IPSS did not take into account differences in the educational and sociodemographic background of enrolled patients. Nevertheless, our study results are valuable because it is the first study to elucidate an association between VPSS and IPSS and different study groups, and it is the first study to elucidate an association between the changes in VPSS and the changes in IPSS after treatment.
In conclusion, our study revealed a significant correlation between the VPSS and the IPSS in evaluating LUTS and BPH in Korean patients, both at the initial visit and longitudinal follow-up examinations. Both scoring systems can be used to assess changes in symptom severity and evaluate treatment efficacy.