Prevalence, Risk Factors, Quality of Life, and Health-Care Seeking Behaviors of Female Urinary Incontinence: Results From the 4th Korean National Health and Nutrition Examination Survey VI (2007-2009)
Article information
Abstract
Purpose
There is a lack of information on female urinary incontinence (UI) in South Korea. We investigated the prevalence, risk factors, quality of life (QoL), and healthcare-seeking behaviors of women with UI.
Methods
We included 9,873 women over the age of 20 years who had participated in the Korea National Health and Nutrition Examination Survey IV. The condition of UI was defined as answering "yes" to the question "Do you have UI?" Additionally, health care seeking behavior for UI was defined as answering "yes" to "Have you ever been treated for UI?' The EuroQoL-5 Dimension (EQ-5D) descriptive system was used to evaluate QoL.
Results
The mean age of our sample was 49.7 years. The overall prevalence of UI was 7.9%. The prevalence of UI significantly increased with age. The rate of healthcare-seeking behavior for UI also significantly increased with age. However, the rate of healthcare seeking for UI was significantly lower when compared to the prevalence of UI. In our multivariate analysis, age, body mass index, and marriage were significantly and independently associated with UI. As the severity of all the subscales of EQ-5D increased, the unadjusted odds ratio for UI also increased. After adjusting for potential confounders, the subscales of mobility, usual activities, pain/discomfort, and anxiety/depression from the EQ-5D were significantly associated with UI.
Conclusions
UI is a common disease and is significantly associated with QoL. Our results suggest the need for developing preventive measures and treatment policies for UI.
INTRODUCTION
The International Continence Society defines urinary incontinence (UI) as "the complaint of any involuntary leakage of urine" [1]. UI is an important health problem resulting in psychological, social, and hygienic impairment, thus affecting the lives of the patients as well as their family [2]. However, there are no studies on the overall prevalence, risk factors, quality of life (QoL), and healthcare-seeking behaviors of women with UI in South Korea. The only available data are from rural areas and sanatoriums [3,4,5]. The aforementioned issues need to be addressed in order to promote health and organize the healthcare services related to UI. Therefore, we undertook the present study using data from the Korea National Health and Nutrition Examination Survey IV (KNHANES) to investigate information about adult female UI.
MATERIALS AND METHODS
Study Subjects
This study utilized data from the KNHANES IV. The KNHANES was conducted by the Korea Centers for Disease Control and Prevention to examine the general health and nutritional status of Koreans. To select a representative sample of the Korean population, they used a stratified three-stage clustered probability design (local district → enumeration district → household). To date, four surveys have been completed as follows: I (1998), II (2001), III (2005), and IV (2007-2009). KNHANES IV enrolled 31,705 individuals. Among them, 24,871 individuals participated in the survey. To elucidate the prevalence, risk factors, QoL, and healthcare-seeking behaviors of women with UI, we excluded subjects below the age of 20 years. Individuals with missing data on UI (n=501) were also excluded. The final study cohort included 9,873 women.
Evaluation of the Prevalence of UI and the Rate of Healthcare-Seeking Behavior for UI
Individuals were classified as having UI if they responded "yes" to the survey question "Do you have UI?" Additionally, healthcare-seeking behavior for UI was defined as responding "yes" to the following question: "Have you ever been treated for UI?"
Estimation of QoL
The EuroQoL-5 Dimension (EQ-5D) descriptive system was used to evaluate QoL. The EQ-5D descriptive system describes general health in terms of five dimensions: mobility, self-care, usual activities, pain/discomfort, and anxiety/depression [6]. Each dimension has three levels, corresponding to no problems, some or moderate problems, and extreme problems, resulting in a total of 243 unique health states [6,7]. The EQ-5D is a well-established and internationally used generic preference-based instrument for assessing health-related QoL [8]. The validity and reliability of Korean EQ-5D has been previously established [9].
Statistical Analysis
We first calculated the prevalence of UI and the rate of healthcare-seeking behavior according to age group. We then evaluated the factors associated with UI. Finally, we evaluated the association between UI and quality of life (using the EQ-5D) after adjusting for potential confounders (age, body mass index [BMI], home income, education, hypertension, diabetes, stroke, marital status, and place of residence).
Statistical analyses included the chi-square test, Mantel-Haenszel extension, and logistic regression analyses; these analyses were performed using the SPSS ver. 11.0 (SPSS Inc., Chicago, IL, USA). Values of P<0.05 were considered statistically significant.
RESULTS
Patient Characteristics
Table 1 shows the baseline characteristics of subjects in this study. The mean age was 49.7 years. The mean body weight and BMI were 57.0 kg and 23.4 kg/m2, respectively.
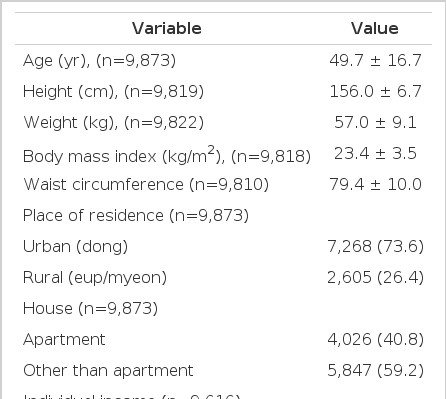
Socio-demographic characteristics
Prevalence of Urinary Incontinence and Rate of Healthcare-Seeking Behavior According to Age Group
The prevalence of UI was 7.9% (n=777) among women over the age of 20 years. The prevalence of UI among women over the age of 40 years and 60 years was 10.1% and 10.3%, respectively. Fig. 1 illustrates the prevalence of UI and the rate of healthcare-seeking behavior according to age group. The total number of women in their 20s, 30s, 40s, 50s, 60s, and above 70s was 1,193, 2,037, 1,919, 1,651, 1,581, and 1,492, respectively. The number of UI patients in their 20s, 30s, 40s, 50s, 60s, and above 70s was 10, 93, 178, 178, 173, and 145, respectively. Additionally, the number of women in their 20s, 30s, 40s, 50s, 60s, and above 70s who showed healthcare-seeking behavior for UI was 1, 1, 6, 4, 6, and 18, respectively.

The prevalence of urinary incontinence (UI) and the rate of healthcare-seeking behavior for UI. The prevalence of UI and the rate of healthcare-seeking behavior for UI both increased with age (P trend < 0.001). However, the rate of healthcare-seeking behavior for UI was significantly lower than the prevalence of UI (P<0.001).
The prevalence of UI increased with age (P trend<0.001). The rate of healthcare-seeking behavior for UI (the number of individuals seeking health care for UI/total number in each age group) also increased with age (P trend<0.001). However, the rate of healthcare-seeking behavior for UI was significantly lower than the prevalence of UI (P<0.001).
Factors Associated With Urinary Incontinence
Multivariate analysis identified age, BMI, and marriage as significant independent risk factors for UI (Table 2). Income, education, type of residence, hypertension, diabetes, and stroke were not independently associated with UI.
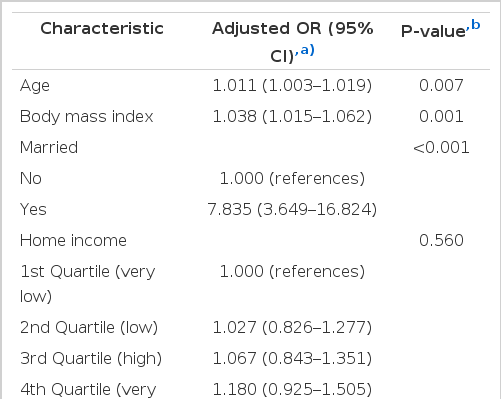
Factors associated with urinary incontinence
Relationship Between Urinary Incontinence and EQ-5D
As the severity of all the EQ-5D subscales increased, the unadjusted OR for UI also increased (Table 3). After adjusting for potential confounders, the subscales for mobility, usual activities, pain/discomfort, and anxiety/depression remained significantly associated with UI (Table 3).

Relationships between incontinence and quality of life assessed by EQ-5D
DISCUSSION
To the best of our knowledge, this is the first study evaluating the prevalence of female UI in South Korea. The prevalence of UI in this study was 7.9%, and this finding is similar to other Asian population studies that reported prevalence rates ranging from 4.8% to 13.0% [10,11]. According to the age group, the prevalence rates of UI among women over the ages of 40 and 60 years were 10.1% and 10.3%, respectively. This finding was lower than the overall UI prevalence rates reported in Japanese women over the age of 40 years (53.7%) [12] and Taiwanese women aged 65 years or older (27.7%) [13]. However, it is important to note that the response rate of the Japanese survey was 53% and data were collected by mailed survey. In addition, the Taiwanese study only included women over the age of 65 years, and population sampling was performed by randomly sampled town populations. These factors may account for the difference in the observed study results.
Parity, age, and obesity are the three most thoroughly studied factors associated with UI [14,15,16]. In the present study, multivariate analysis identified age, BMI, and marriage as significant independent risk factors for UI. We were unable to assess parity as a risk factor because this information was not available in KNHANES IV. However, marital status, which is related to parity, showed a significant association with UI. The number of unmarried mothers in Korea is lower than that in western countries, and Korean traditions dictate that childbirth should follow marriage. Thus, marriage could be interpreted as a proxy for parity in this study. The results of this study may be helpful in identifying cases of UI when establishing a health policy for women with UI in Korea.
In this study, hypertension, diabetes, and stroke, which were thought to be associated with neurogenic bladder dysfunction, were not related to UI. We were unable to study the subtypes of UI because of the lack of this data. This may explain why hypertension, diabetes, and stroke were not identified as risk factors in this study. Further follow-up studies are required to elucidate these risk factors.
Compared to the prevalence rate of UI in Korean women, the consultation rate for UI is significantly lower, which is concordant with the pattern observed worldwide. A recent review article reported that only one in four women with UI in the United States and one in three women in Europe had sought medical care for UI [15,17]. A study of UI in Japanese women showed that only 3% had ever consulted doctors or other healthcare professionals [12,16]. Chinese data show that the consultation rate was 25%. This low consultation rate may be explained by the common misconception that UI is not a disease, but a natural consequence of aging, and that UI is not treatable.
In this study, UI was associated with an impaired QoL. After adjusting for potential confounders, impaired mobility, usual activity, pain/discomfort, and anxiety/depression were still associated with UI. A cross-sectional study from Turkey reported that 87.2% of women indicated that UI has a negative impact on their QoL [2]. Another study from the United States reported that the UI group was almost twice as likely to feel depressed as the non-UI group, and that UI had a significant negative impact on all aspects of QoL after adjusting for comorbidities and demographic differences [18]. The aforementioned results collectively support the finding that UI is associated with an impaired QoL, regardless of ethnicity and nationality.
The success rate of UI treatment has been reported to be very high. In up to 70% of women with mild stress UI, pelvic floor (Kegel) exercises can result in better control of the bladder when coughing, laughing, sneezing, or exercising [19]. In addition, long-term follow-up studies of surgical treatment (tension-free vaginal tape) for severe stress UI report that the cure rate ranges from 77% to 84.7% [20,21]. Furthermore, diverse treatment options (anticholinergics, alpha-blocker, botulinum toxin A, and neuromodulation) are available based on the patient's condition and the type of UI (urge, mixed, overflow, and functional/neurogenic UI) [22]. Treatment of UI means improving the patient's QoL [23,24]. However, compared with the prevalence rate of UI in Korean women, the consultation rate for UI is significantly low. Recently, the Health Insurance Review and Assessment Service reported that the number of anti-incontinence surgeries have increased from 5,944 cases in 2001 to 44,691 cases in 2006. Despite this increase in the number of surgeries, the consultation rate for UI remains low. Therefore, we think that a more efficient health policy is required for women with UI in Korea.
The present study had several limitations. First, the cross-sectional nature of the dataset makes causal inferences problematic. Second, we cannot elucidate the relationship between UI and parity, which is a well-known risk factor for UI. In addition, we could not study the subtypes of UI, as this information was not available. Nevertheless, we think that our study provides meaningful results, as this is the first study to elucidate the prevalence, risk factors, healthcare-seeking behaviors, and QoL of women with UI in Korea.
In conclusion, UI is a common disease and is significantly associated with QoL. Compared to the prevalence rate of UI in Korean women, the consultation rate for UI is significantly lower. Our results suggest the importance of developing preventive measures and treatment policies for UI.
Notes
No potential conflict of interest relevant to this article was reported.