Prediction of Prostate Cancer Risk Stratification Based on A Nonlinear Transformation Stacking Learning Strategy
Article information

Abstract
Purpose
Prostate cancer (PCa) is an epithelial malignancy that originates in the prostate gland and is generally categorized into low, intermediate, and high-risk groups. The primary diagnostic indicator for PCa is the measurement of serum prostate-specific antigen (PSA) values. However, reliance on PSA levels can result in false positives, leading to unnecessary biopsies and an increased risk of invasive injuries. Therefore, it is imperative to develop an efficient and accurate method for PCa risk stratification. Many recent studies on PCa risk stratification based on clinical data have employed a binary classification, distinguishing between low to intermediate and high risk. In this paper, we propose a novel machine learning (ML) approach utilizing a stacking learning strategy for predicting the tripartite risk stratification of PCa.
Methods
Clinical records, featuring attributes selected using the lasso method, were utilized with 5 ML classifiers. The outputs of these classifiers underwent transformation by various nonlinear transformers and were then concatenated with the lasso-selected features, resulting in a set of new features. A stacking learning strategy, integrating different ML classifiers, was developed based on these new features.
Results
Our proposed approach demonstrated superior performance, achieving an accuracy of 0.83 and an area under the receiver operating characteristic curve value of 0.88 in a dataset comprising 197 PCa patients with 42 clinical characteristics.
Conclusions
This study aimed to improve clinicians’ ability to rapidly assess PCa risk stratification while reducing the burden on patients. This was achieved by using artificial intelligence-related technologies as an auxiliary method for diagnosing PCa.
• HIGHLIGHTS
- This article introduces a novel machine learning approach utilizing a stacking strategy for prostate cancer (PCa) risk stratification, overcoming the limitations of prostate-specific antigen levels. Through the integration of clinical records with a novel set of features derived from various machine learning classifiers, this approach realized substantial improvements in accuracy and area under the receiver operating characteristic curve values. The method aims to enhance clinical PCa risk assessment, reducing unnecessary biopsies and patient burden.
INTRODUCTION
Prostate cancer (PCa) is the second most common cancer among men worldwide [1]. The incidence and mortality rates of PCa increase with age [2]. The gold-standard method for diagnosing PCa in patients is a pathological examination of tissue obtained via biopsy. The Gleason score (GS) is recognized as a critical predictor in many PCa studies [3]. Risk stratification for PCa typically involves assessing serum prostate-specific antigen (PSA) levels, GS, and a range of clinical factors. This stratification system classifies PCa into low, intermediate, or high risk, which helps clinicians make informed treatment choices and prognostic evaluations.
The treatment of patients with PCa varies significantly according to risk stratification. For instance, very low and lowrisk patients may undergo active surveillance, intermediate-risk patients often receive radical treatment, and those with highrisk or metastatic disease typically undergo comprehensive androgen deprivation therapy-based treatment [4]. Inaccurate risk assessment of PCa patients can result in severe psychological distress and substantial financial burdens. Consequently, there is a critical need to develop a non-invasive approach that can efficiently and accurately determine the malignancy level in PCa patients and predict their risk stratification [5].
Current efforts to stratify PCa risk are broadly categorized into 2 approaches: traditional machine learning (ML) methods that rely on clinical records and deep learning methods that utilize multimodal data, incorporating both clinical records and medical images. In 2019, Hood et al. [6] selected 8 features from 32 clinical characteristics using a genetic algorithm and a statistical test to construct a feature subset. They then assembled 3 K-nearest neighbors models to classify PCa malignancy and to predict low/intermediate and high-risk dichotomies. In 2021, Liang et al. [7] reported good performance in predicting PCa malignancy using a multiparametric radiomic model and a combined clinical-radiomic model. More recently, in 2023, Yang et al. [8] demonstrated good performance in predicting PCa risk stratifications based on functional subsets of peripheral lymphocytes. However, these studies were limited by the relatively small size of the clinical datasets used and did not offer a tripartite risk stratification.
This study introduces a novel stacking learning approach designed to predict low, intermediate, and high-risk stratifications for patients with PCa. The performance of the algorithm was evaluated and benchmarked against widely-used ML models as well as the conventional stacking algorithm.
The contributions of this work are summarized as follows.
· A novel stacking learning classification algorithm was developed by integrating nonlinear transformation (NT) strategies with an ML model pool.
· The proposed algorithm was validated on a dataset of 197 patients with 42 clinical characteristics, demonstrating superior performance for PCa risk stratification. Additionally, our algorithm was validated with the Kaggle Challenge (PI-CAI [9]) dataset.
· The proposed algorithm is publicly available as the “stackingNT” Python package, making it easily accessible to the research community.
MATERIALS AND METHODS
First, clinical records were preprocessed using the lasso algorithm to identify a refined subset of features, and the statistical significance of these selected features was then verified. Second, we trained 5 different ML classifiers as base models [10]. Based on the prediction results from these base models, various NT strategies were applied to derive a new set of features. Third, these newly generated features were combined with the initially selected clinical features to form the input for an ML model, referred to as the meta-model [11]. Concurrently, we evaluated the performance of different ML classifiers when used as metamodels, which influenced the experimental outcomes. Finally, we selected the combination of the highest-performing metamodel and NT strategy for the predictive outcome. Additionally, we compared our proposed method with popular ML algorithms and a stacking algorithm based on logistic regression (LR) [12].
The workflow of this study is shown in Fig. 1. Fig. 2 illustrates the construction pipeline of the NT stacking learning strategy.
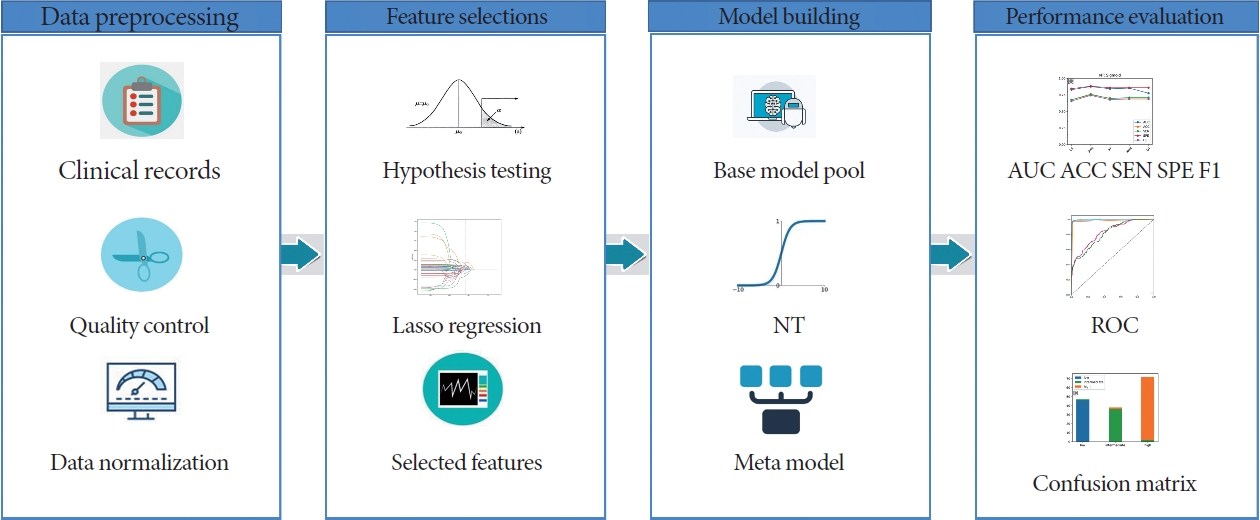
Workflow for the proposed approach for prostate cancer risk stratification. NT, nonlinear transformation; AUC, area under the curve; ACC, accuracy; SEN, sensitivity; SPE, specificity; ROC, receiver operating characteristic.
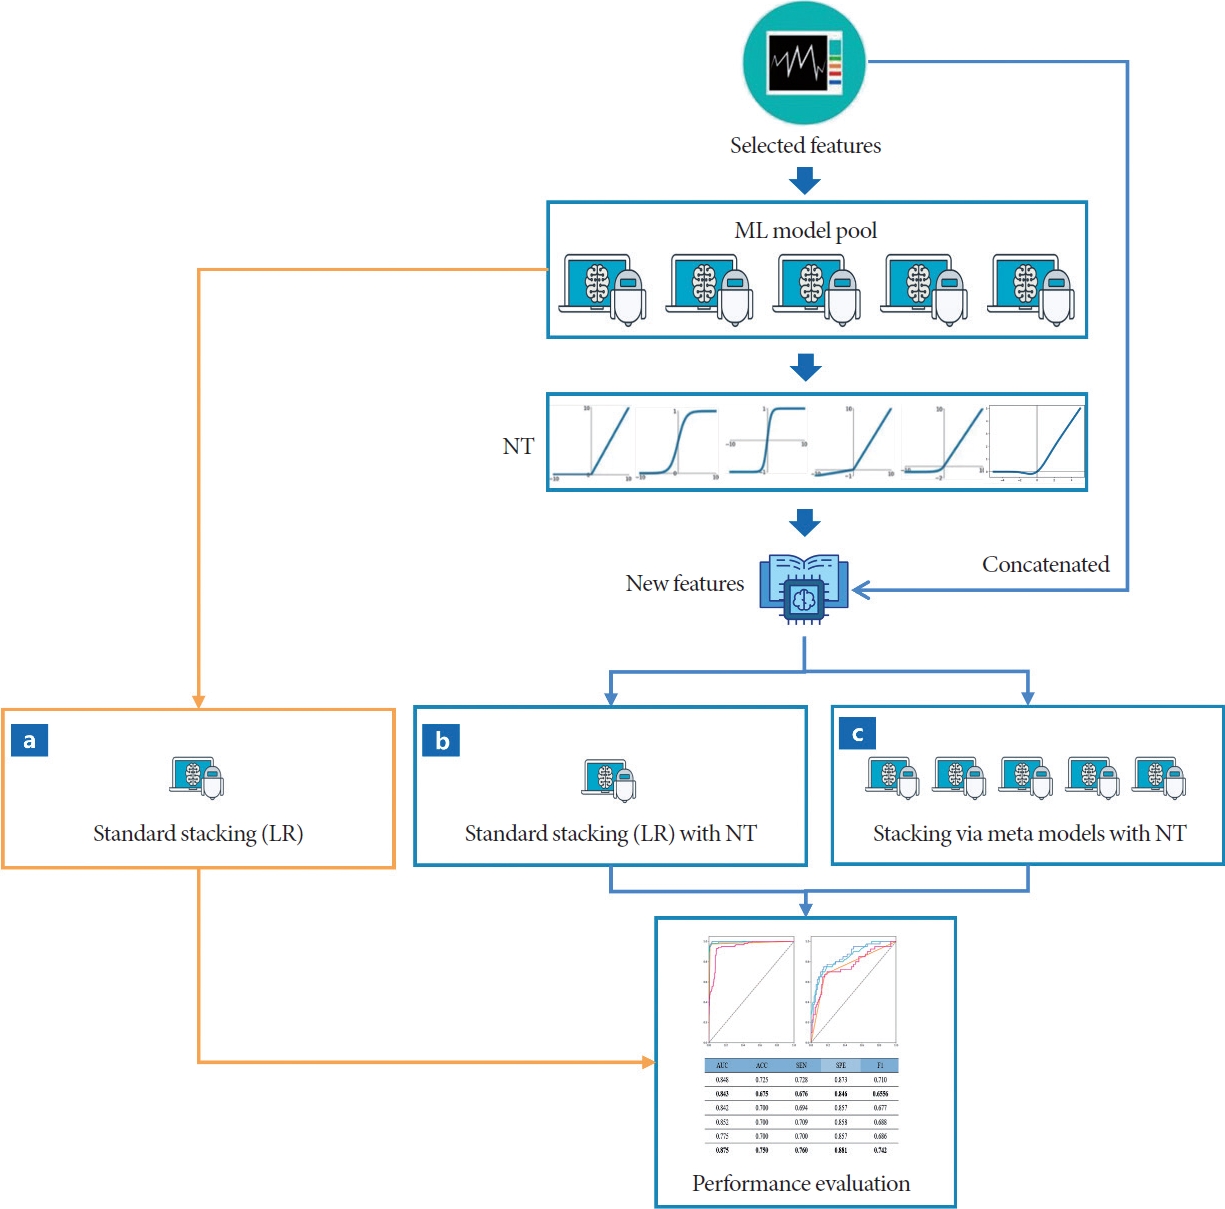
Pipeline of the proposed NT stacking strategy (c). For the performance comparison, the pipelines of standard stacking (LR) without NT (a) and standard stacking (LR) with NT (b) are also shown. ML, machine learning; NT, nonlinear transformation; LR, logistic regression.
Data Collection and Preprocessing
The data for this study were collected at Wuhan Tongji Hospital between August 1, 2020 and October 20, 2022. We recruited a total of 197 PCa patients, which included 59 low-risk, 48 intermediate-risk, and 90 high-risk patients. The clinical records were preprocessed to remove outliers and duplicate entries. We capped the values for PSA at 1,000 ng/mL for readings above this threshold, set alanine transaminase values below 5 U/L to 5 U/L, and adjusted interleukin-6 values below 1.5 pg/mL to 1.5 pg/mL. Interleukin-10 was removed from the records due to an excessive number of duplicate values. After this preprocessing, 41 features were retained for analysis. It is important to note that the stratification of PCa patients into 3 risk groups followed the European Association of Urology guidelines [13]. The dataset was subsequently divided in a 4:1 ratio, with 80% of the data being used for training, employing a 10-fold cross-validation approach, and the remaining 20% reserved for performance evaluation.
Data Normalization and Lasso for Feature Screening
Data normalization ensures that preprocessed data are confined within a specific range, thereby mitigating the adverse effects of anomalous sample data [14]. We employed z-score normalization as our method of choice, as follows.
Where X is the individual sample value, U is the total sample mean, and σ is the total sample standard deviation.
When using ML techniques to process large datasets, it is often necessary to reduce the dimensionality of the data. The lasso algorithm operates on the principle of minimizing the sum of squared residuals, subject to the condition that the sum of the absolute values of the regression coefficients remains below a specified constant. This approach allows for some regression coefficients to be exactly zero, resulting in a more interpretable model. The equation for this model is presented as Equation (2) [15].
Where Y is the target variable, X is the eigenmatrix, B is the parameter vector, P is the number of variables, and α>0 is a hyperparameter. The compression of the overall regression coefficient can be achieved by adjusting the hyperparameter α. The value of α can be estimated using the cross-validation method [16]
ML Algorithms and Standard Stacking Algorithm
This study utilized 5 popular ML algorithms—support vector machine (SVM) [17], decision tree (DT) [18], random forest (RF) [19], XGBoost (XGB) [20], and LR—to predict the risk stratification of PCa patients. These models were trained using 10-fold cross-validation on a training set that contained 8 clinical features, and then evaluated for performance on a test set. We then selected the best-performing ML model for the subsequent performance assessment.
For the standard stacking (LR) algorithm, this study utilized the same 5 ML classifiers, including SVM, DT, RF, XGB, and LR, as the base model [21]. After lasso and hypothesis testing, 8 selected features were entered into the base model, the prediction results were obtained. To better preserve the information from the original clinical features, we were inspired by shortcut connections in the ResNet network [22] and concatenated the ML models’ predicted results with the selected features of the clinical records to form a new dataset, which was used as the training data for the meta-model. We used LR as the metamodel and evaluated its performance on the test set. The algorithmic process is shown in Fig. 2a.
Standard Stacking (LR) With NT
Various NT strategies, including the cosine function (cos), Gaussian error linear units (Gelu) [23], logistic sigmoid (sigmoid), sine function (sin), Softplus function (Softplus) [24], and hyperbolic tangent function (Tanh), were utilized with the outputs of 5 ML models to generate NT features. We concatenated these transformed features with the selected clinical features to form a set of new features, which were then fed them into the standard stacking (LR) algorithm (Fig. 2b).
Development and Validation of the Proposed Stacking Learning Strategy
The proposed stacking learning strategy was developed using different NTs with various meta-models (Fig. 2c), searching for the optimal combination of an NT strategy and a meta-model. In the experiment, a total of 6 NT strategies and 5 ML models were utilized.
Statistical Analysis
The implementation of ML algorithms, lasso regression, and receiver operating characteristic curve analysis was carried out using the Scikit-learn package in Python 3.8. Hypothesis testing was conducted using IBM SPSS Statistics ver. 26.0 (IBM Co., Armonk, NY, USA). A 2-sided P-value of less than 0.05 was considered statistically significant. Analysis of variance was used for continuous variables conforming to normal distribution and homogeneity of variance [25]. Other continuous and categorical variables were tested using the Kruskal-Wallis H test [26].
RESULTS
Characteristics of Patients
The study examined 41 features in patients with low, intermediate, and high-risk profiles and identified statistically significant differences in 14 clinical characteristics (P<0.05). These characteristics include age, PSA levels, neutrophil counts, hemoglobin levels, alkaline phosphatase activity, lactate dehydrogenase activity, T-cell counts (CD3+CD8+), regulatory T-cell counts (CD3+CD4+CD25+CD127low+), induced regulatory T-cell counts (CD45RO+CD3+CD4+CD25+CD127low+), and levels of interleukin-1, interleukin-2R, interleukin-6, interleukin-8, and tumor necrosis factor (refer to Table 1).

Clinical characteristics of patients
We then performed a feature selection process using the lasso algorithm and identified an optimal set of 8 clinical features for the subsequent analysis. These features, which are presented as the final trial features in Fig. 3, include age, PSA, alkaline phosphatase, lactate dehydrogenase, regulatory T cells (CD3+CD4 +CD25+CD127low+), interleukin-1β, interleukin-2R, and interleukin-6.
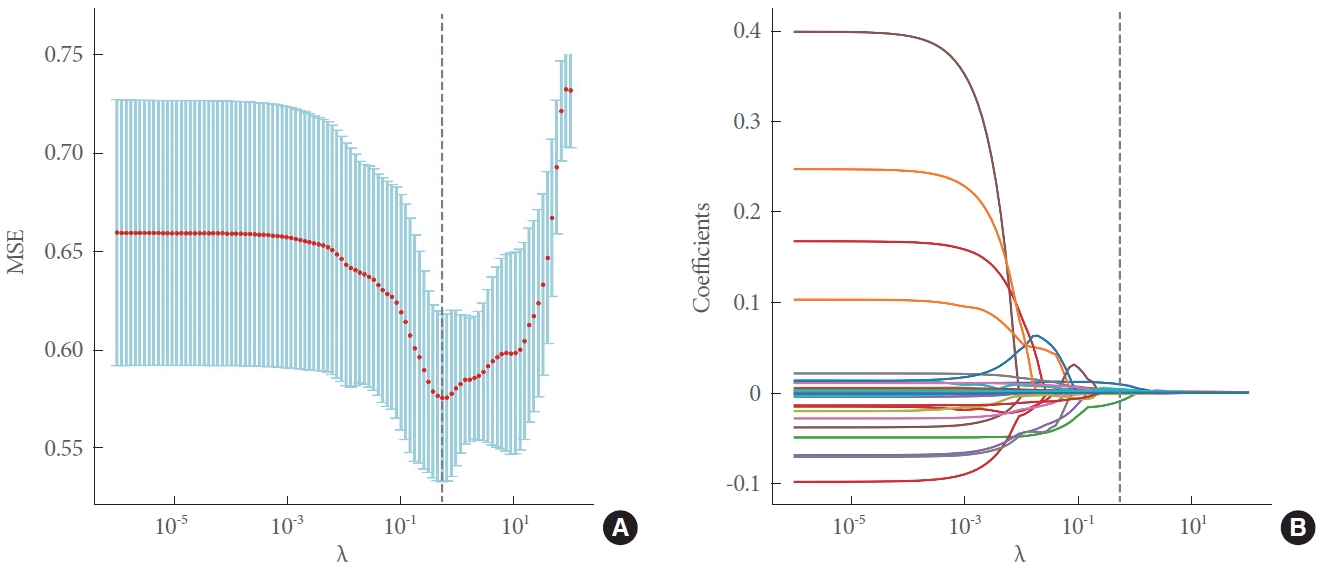
(A) Five-fold cross-validation for tuning the hyperparameter λ selection in lasso regression. (B) Lasso coefficient profiles of the 41 variables. As the value of λ decreased, the degree of model compression increased, and 14 features were selected. MSE, mean squared error.
Performance Evaluation of ML Models, the Standard Stacking (LR) Algorithm, and the Standard Stacking (LR) Algorithm With NT
The 8 selected features were learned with 5 popular ML models, the standard stacking (LR) algorithm and the standard stacking (LR) algorithm with the NT strategy. The performance is shown in Table 2. Among the ML models, the XGB model achieved the best overall performance, with an area under the curve (AUC) of 0.789 and an accuracy of 0.700, and the standard stacking (LR) algorithm achieved an AUC of 0.839 and an accuracy of 0.817. The standard stacking (LR) algorithm with additional Gelu transformations achieved an AUC of 0.856 and an accuracy of 0.816. The NT strategy introduced in the standard stacking (LR) algorithm significantly improved the performance of the meta-model.
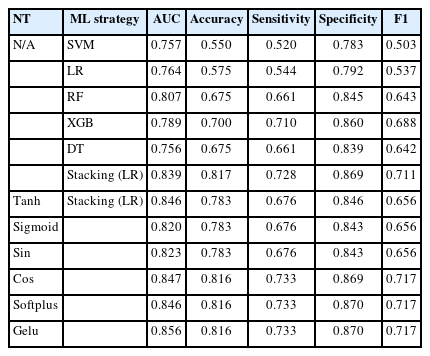
Performance evaluation of ML models, the standard stacking (LR) algorithm, and the standard stacking (LR) algorithm with NT
Performance of Different NT and ML Strategy Combinations in Stacking
The NT strategy, as introduced in the standard stacking (LR) algorithm, can significantly enhance the performance of the meta-model. We experimented with various NT combinations across different meta-models, as shown in Fig. 4. Our extensive comparative experiments revealed that the pairing of the sigmoid NT with SVM yielded the most superior results, achieving an AUC of 0.876 and an accuracy of 0.833, as detailed in Table 3. This optimal combination resulted in a 6.82% increase in the AUC and a 6.38% increase in accuracy when compared to the sigmoid+stacking (LR) combination.
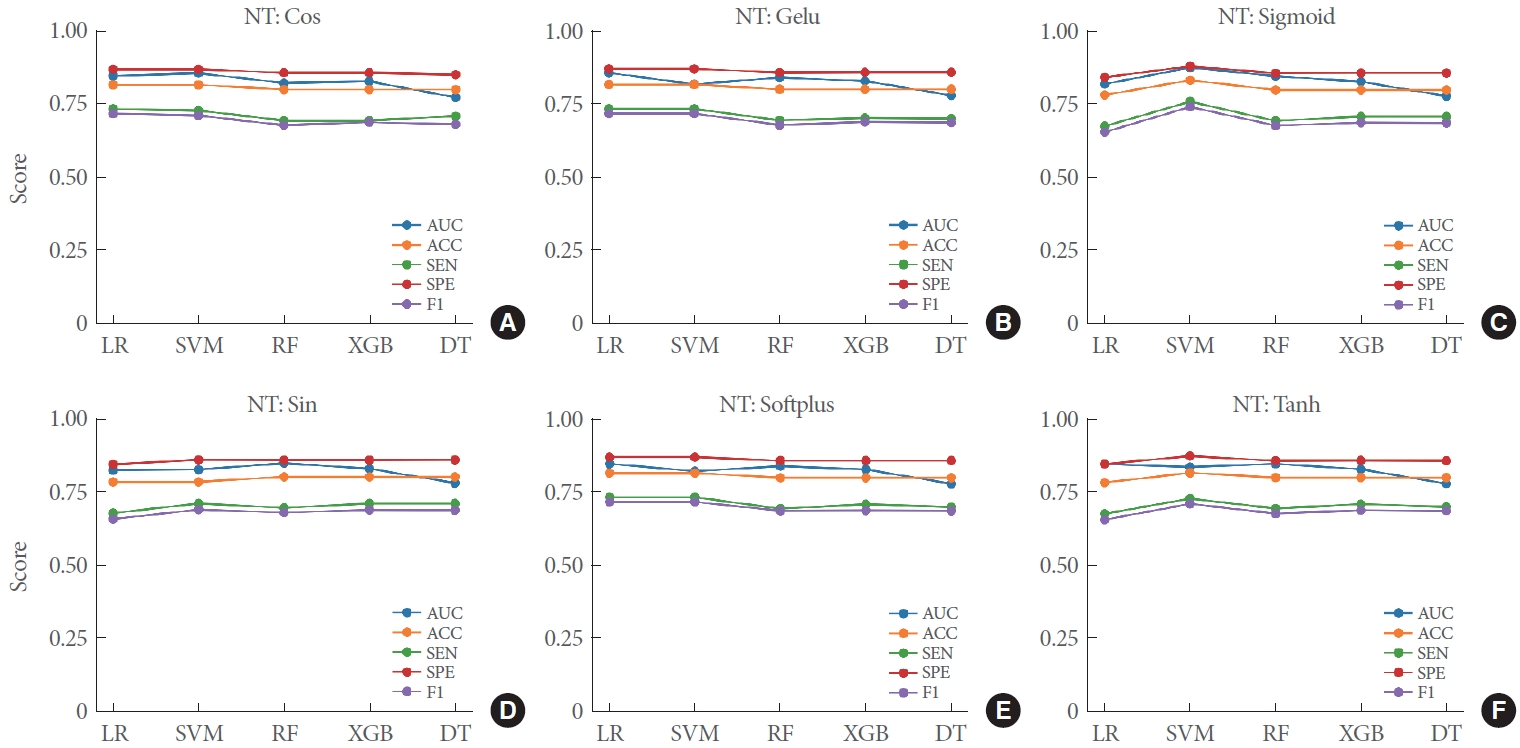
Performance evaluation of meta-models with different NT strategies. Panels A–F indicate the performance of NT: Cos, NT: Gelu, NT: Sigmoid, NT: Sin, NT: Softplus, NT: Tanh in different meta-models, respectively, for the risk stratification of prostate cancer. NT, nonlinear transformation; Cos, cosine; Gelu, Gaussian error linear units; Sigmoid, logistic sigmoid; Tanh, hyperbolic tangent; LR, logistic regression; SVM, support vector machine; RF, random forest; XGB, XGBoost; DT, decision tree.
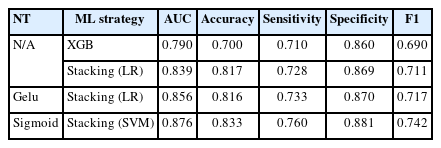
Performance comparison of XGB, standard stacking (LR) algorithm, Gelu+standard stacking (LR) algorithm, and sigmoid+stacking (SVM) algorithm
Performance Evaluation of the NT Stacking Strategy
This section compares the performance of the optimal model combination (sigmoid+stacking [SVM]) with that of the XGB, standard stacking (LR), and Gelu+stacking (LR) models. The proposed optimal combination algorithm achieved a 10.88% improvement in AUC compared to the popular ML model XGB, a 4.41% improvement compared to the standard stacking (LR) algorithm, and a 2.33% improvement compared to the sin+stacking (LR) algorithm (Fig. 5A). The figure demonstrates that our method substantially improves risk stratification for active surveillance in PCa (Fig. 5B). Furthermore, the proposed NT stacking algorithm outperformed other methods across all performance metrics, including accuracy of 0.833, sensitivity of 0.760, specificity of 0.881, and F1 of 0.742 (Table 3). These experimental results demonstrate the superiority of the proposed optimal stacking algorithm combination in achieving improved performance.

Receiver operating characteristic curves for XGBoost (XGB), standard stacking (LR), Gelu+standard stacking (LR), and sigmoid+stacking (SVM) in the training set (A) and testing set (B). Number of prostate cancer patients in low-, intermediate-, and high-risk groups according to the sigmoid+stacking (SVM) predictive scores in the training (C) and test set (D). AUC, area under the curve; LR, logistic regression; Gelu, Gaussian error linear units; Sigmoid, logistic sigmoid; SVM, support vector machine.
Analysis of Feature Importance in NT Stacking
Analyzing feature importance in ML models is essential for their interpretability, especially for models applied for auxiliary diagnoses. Therefore, it is necessary to investigate how clinical features and NT features from various ML models contribute to predictions made by NT stacking models. For the best-performing NT stacking model (i.e., sigmoid+stacking [SVM]), the analysis revealed that the top 3 most important features (NT of the outputs of XGB, DT, and RF) contributed nearly 95% (Fig. 6). This result demonstrates the effectiveness of the proposed NT strategy in stacking learning. In addition, PSA, as a clinical feature, was ranked the fourth most important feature.
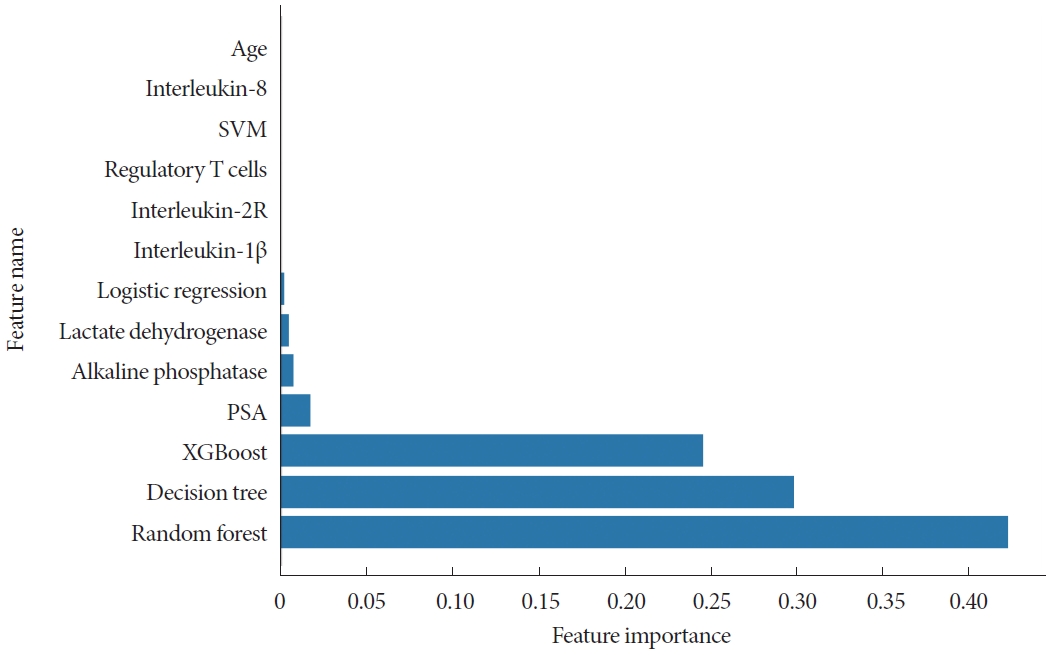
Feature importance of the NT: sigmoid+stacking (SVM) strategy. NT, nonlinear transformation; SVM, support vector machine; PSA, prostate-specific antigen.
DISCUSSION
The study analyzed a cohort of 197 patients, from whom 42 clinical characteristics across functional subsets of peripheral lymphocytes were collected. After conducting Lasso regression and hypothesis testing, we identified an optimal subset of 8 clinical features. We then introduced a shortcut connection within the standard stacking (LR) algorithm by concatenating NT features with those selected by the lasso algorithm to create a new training set. Additionally, we investigated the optimal combination of various NT strategies and popular ML models. The analysis of feature importance underscored the effectiveness of our proposed stacking strategy. When compared with 5 other ML algorithms and the standard stacking (LR), our proposed stacking algorithm demonstrated superior performance, achieving an accuracy of 0.833 and an AUC of 0.876.
Previous studies have primarily concentrated on the binary classification of PCa patients into low/intermediate and highrisk groups, often with a relatively small sample size. Related research has typically addressed the benign versus malignant binary classification, as well as the low/intermediate versus highrisk binary classification in PCa patients [6,27]. In contrast, our study categorized 197 PCa patients into low, intermediate, and high-risk groups, providing a classification that more closely aligns with clinical treatment decisions. Additionally, to promote the practical use and reproducibility of our stacking algorithm, we have created an open-source Python package called “stackingNT.” This package, which includes an implementation of our algorithm, is accessible at https://pypi.org/project/stackingNT/. The package includes an implementation of our proposed algorithm. The installation instructions and user guide can be found at stackingNT·PyPI.
This study has several limitations. First, all clinical data were collected from a single center, which suggests that a multi-center cross-validation study would be valuable in the future. Second, investigating additional ML models and NT techniques could improve the study. Finally, imaging data are crucial for the diagnosis of PCa, and incorporating imaging data modalities is expected to further improve the diagnostic efficiency of the proposed approach.
In summary, we have proposed a novel stacking algorithm that integrates an NT strategy with a pool of ML models to improve the predictive performance of risk stratification in PCa. We believe that this approach could be applied to a broader range of clinical modality data analyses.
Notes
Grant/Fund Support
This work was supported by the graduate innovation fund of Wuhan Institute of Technology (No. CX2022330) and the graduate innovation fund of Wuhan Institute of Technology (No. CX2022334).
Research Ethics
The study was approved by the Research Ethics Commission of Wuhan Tongji Hospital and the requirement for informed consent was waived by the Ethics Commission (IRB ID: TJ- IRB20211246).
Conflict of Interest
No potential conflict of interest relevant to this article was reported.
AUTHOR CONTRIBUTION STATEMENT
· Conceptualization: XC, CY, ZL, YJ, PW, WS, HX, XW
· Data curation: XC, YF, CY, ZL, YJ, PW, WS, HX
· Formal analysis: XC, WS, HX
· Funding acquisition: XW
· Methodology: XC, YF, GX, YJ, PW, XW
· Project administration: XC, GX, XW
· Visualization: XC, YF
· Writing - original draft: XC, YF, XW
· Writing - review & editing: XC, YF, XW