INJ Search

CLOSE


Int Neurourol J > Volume 24(1); 2020 > Article
Wu, Ting, Lin, and Hsiao: Clinical and Urodynamic Predictors of the Q-Tip Test in Women With Lower Urinary Tract Symptoms

ABSTRACT

Purpose

The Q-tip test is used to measure urethral hypermobility and can predict surgical outcomes. However, certain factors may affect the reliability of this test. Our aim was to identify independent clinical and urodynamic predictors of the results of the Q-tip test.

Methods

Between January 2014 and June 2019, 176 consecutive women with lower urinary tract symptoms who underwent the Q-tip test and urodynamic studies were included in this retrospective study.

Results

Multivariable regression analysis revealed that age (regression coefficient, -0.55), point Ba (regression coefficient, 4.1), urodynamic stress incontinence (regression coefficient, 9.9), maximum flow rate (Qmax) (regression coefficient, 0.13), pressure transmission ratio (PTR) at maximum urethral pressure (MUP) (regression coefficient, -0.14), and the score on the fifth question of the Incontinence Impact Questionnaire (IIQQ5; “Has urine leakage affected your participation in social activities outside your home?”; regression coefficient, -4.1) were independent predictors of the Q-tip angle, with a constant of 87.0. The following Spearman rank correlation coefficients were found between the Q-tip angle and the following variables: age, -0.38; point Ba, 0.34; urodynamic stress incontinence, 0.32; Qmax, 0.28; PTR at MUP, -0.28; and IIQQ5, -0.23. A receiver operating characteristic curve (ROC) analysis for the prediction of urodynamic stress incontinence found that the optimum cutoff for PTR at MUP was <81%, with an area under the ROC curve of 0.70.

Conclusions

Age, point Ba, urodynamic stress incontinence, Qmax, PTR at MUP, and IIQQ5 were independent predictors of the Q-tip angle. However, none of these could be used as effective surrogates for the Q-tip test due to their lack of a sufficient correlation.

INTRODUCTION

The Q-tip test is a long-standing urogynecological examination, first developed by Crystle et al. in 1971 [1]. It is a simple and objective method to measure urethral hypermobility in women with stress urinary incontinence (SUI). The Q-tip test has been used to predict the surgical outcomes of anti-incontinence surgery. In general [2-4], the Q-tip test has high test-retest reliability [5]. However, some factors, such as patient position, bladder filling state, and anterior vaginal wall relaxation, may affect the reliability of the Q-tip test [6,7].
During the Q-tip test, a cotton swab is inserted into the urethra, which may result in urethral discomfort [8]. However, the Q-tip test still plays an important role in predicting the outcome of anti-incontinence surgery. A higher Q-tip angle has been reported to be associated with higher success rates of midurethral sling procedures [2-4]. Thus, identifying clinical or urodynamic factors that affect the Q-tip angle would facilitate more accurate interpretations of the results of the Q-tip test, enabling more informed preoperative consultations and better prediction of postoperative outcomes. Therefore, the main objective of this study was to identify clinical and urodynamic predictors of the Q-tip angle.

MATERIALS AND METHODS

Between January 2014 and June 2019, all women with lower urinary tract symptoms who underwent Q-tip testing, pad testing, and urodynamic studies were included in this retrospective study. The short form of the Urinary Distress Inventory (UDI) questionnaire, the short form of the Incontinence Impact Questionnaire (IIQ), bladder diaries, and the degree of pelvic organ prolapse were reviewed from the patients’ medical records. The degree of pelvic organ prolapse was determined using the Pelvic Organ Prolapse Quantification system [9]. This study was approved by the research ethics committee of the hospital.
The Q-tip test was performed with the patient in the supine lithotomy position during a pelvic examination at our outpatient clinic. A sterile, lubricated cotton swab was inserted into the urethra to the level of the bladder neck, and the axis change with straining was then measured with a goniometer. The Q-tip angle was defined as the angle at maximum straining as measured from the horizontal plane [10]. A Q-tip angle ≥30° was defined as indicating urethral hypermobility.
With each patient in a seated position, urodynamic studies were performed using a Life-Tech 6-channel monitor with computer analysis and the Urolab/Urovision System V (Life-Tech, Inc., Houston, TX, USA). The urodynamic studies included uroflowmetry, filling cystometry with 35°C distilled water at a rate of 60 mL/sec, a pressure flow study, and a stress urethral pressure profile with a strong-desire volume of distilled water in the bladder [11]. Additionally, a 20-minute pad test was performed for each woman [12].
Urodynamic stress incontinence (USI) was diagnosed when involuntary urine leakage occurred during filling cystometry and was associated with increased intra-abdominal pressure in the absence of a detrusor contraction [9]. Patients who had a strong desire to void at a volume of less than 300 mL were considered to have bladder oversensitivity [13]. Detrusor overactivity (DO) was defined as evidence of spontaneous detrusor contractions occurring during bladder filling or an uninhibited detrusor contraction occurring at a cystometric capacity that usually resulted in voiding [14]. Functional bladder outlet obstruction was evidenced by uroflowmetry results of a maximum flow rate (Qmax) of <12 mL/sec and a detrusor pressure at Qmax of >40 cm H2O measured via voiding cystometry without a known anatomic cause of obstruction [15]. The pressure transmission ratio (PTR) was defined as the increment in urethral pressure upon coughing as a percentage of the simultaneously-reported increment in vesical pressure [10]. In this study, the PTR at maximum urethral pressure (MUP) referred to the PTR measured near or at MUP [16].
All terminology used in this paper conforms to the standards recommended by the joint report published by the International Urogynecological Association and the International Continence Society [9]. All procedures were performed by an experienced technician, and the data were interpreted by a single observer to avoid interobserver variability.
STATA ver. 11.0 (Stata Corp., College Station, TX, USA) was used for statistical analysis. To identify predictors of the Q-tip angle, multivariable backward stepwise linear regression analysis was performed for all variables that showed a significant correlation using the Spearman rank correlation coefficient. A P-value <0.05 was considered to indicate statistical significance.

RESULTS

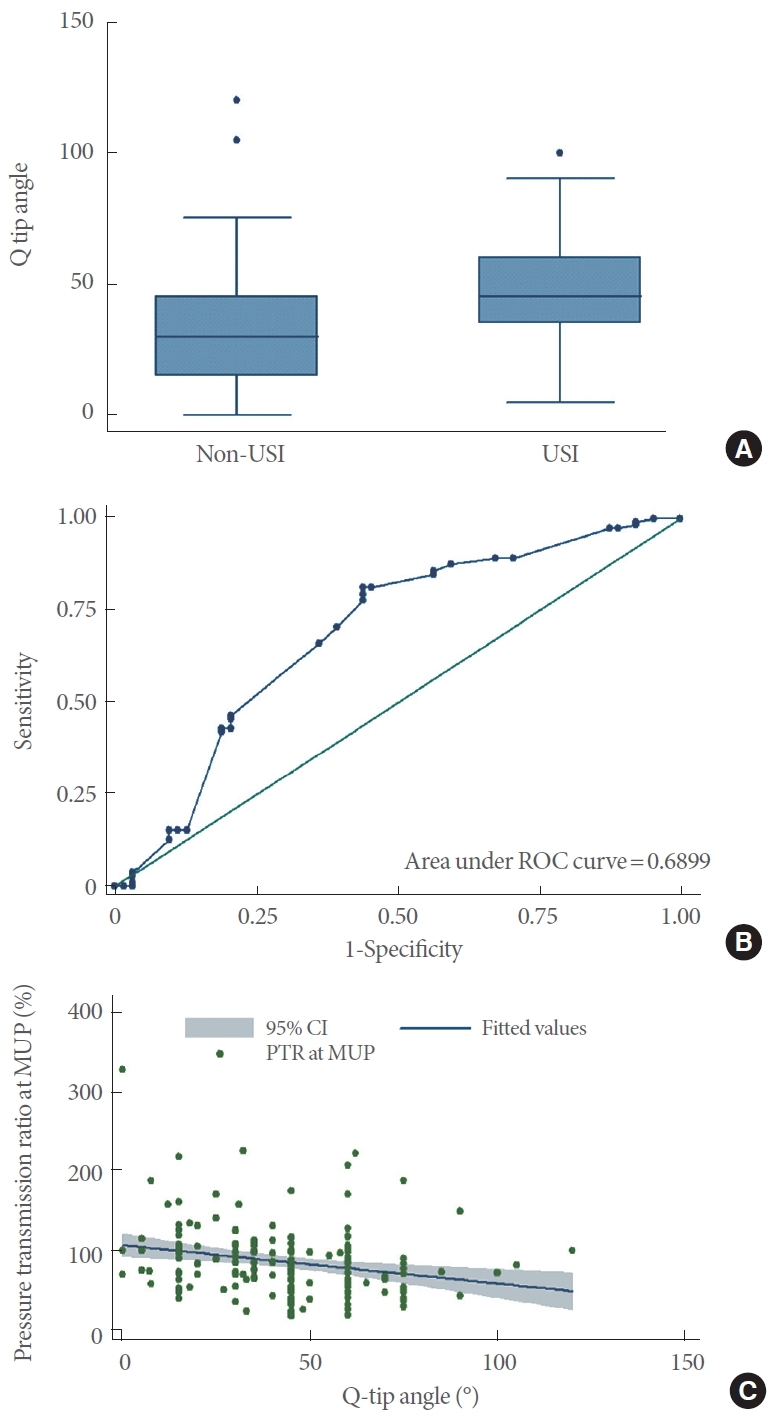
The records of a total of 176 women were reviewed in this study (Table 1). The average Q-tip angle was 43.1°±22.5°. The Q-tip angle differed between women with and without USI (48.0°±19.7° vs. 34.5°±24.6°, respectively; P<0.0001) (Fig. 1A). Based on a receiver operating characteristic curve (ROC) analysis, the optimum Q-tip angle for the prediction of USI was ≥32°, and this cutoff had an area under the ROC curve of 0.69 (95% confidence interval [CI], 0.60–0.78; sensitivity, 81.3%; specificity, 56.3%; Fig. 1B).
We assessed the correlations between the Q-tip angle and clinical and urodynamic parameters, with results shown in Table 2. Age, parity, point Aa, point Ba, point C, SUI, overactive bladder syndrome, voiding dysfunction, USI, DO, pad weight, Qmax, voided volume, PTR at MUP, the score on the third question of the UDI questionnaire (“Urine leakage related to physical activity, coughing or sneezing?”), and the score on the fifth question of the IIQ questionnaire (IIQQ5, “Has urine leakage affected your participation in social activities outside your home?”) were significantly correlated with the Q-tip angle (Table 2).
Multivariable backward stepwise linear regression revealed that only age, point Ba, USI, Qmax, PTR at MUP, and IIQQ5 were independent predictors of the Q-tip angle (Table 3).
Univariate regression analysis with the Q-tip angle showed that the regression coefficient of PTR at MUP was -0.12 (95% CI, -0.20 to -0.05; P=0.001) (Fig. 1C), with a constant of 53.8 (95% CI, 46.6–60.9; P<0.001). Thus, the predicted Q-tip angle for a given PTR at MUP (%, a) could be calculated using the following formula:
Q-tip angle=53.8-0.12×a (R2=0.06).
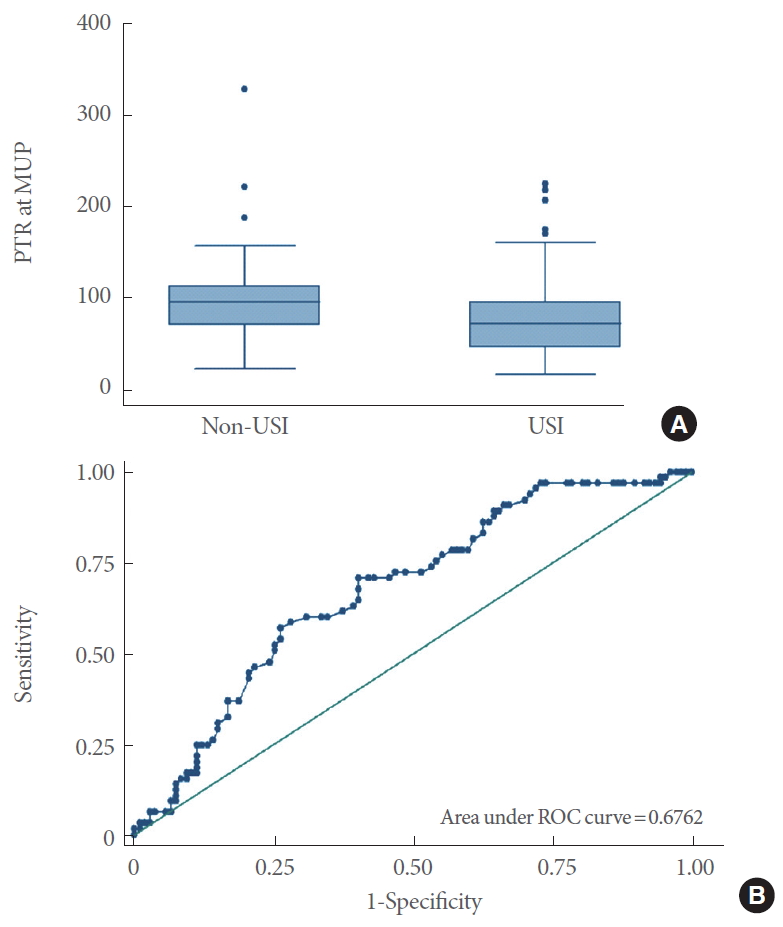
PTR at MUP significantly differed between women with and without USI (77.1%±41.2% vs. 100.0%±46.4%, respectively; P=0.0001) (Fig. 2A). Based on the ROC analysis, for the prediction of USI, the optimum cutoff of PTR at MUP was <81%, with an area under the ROC curve of 0.70 (95% CI, 0.62–0.78; sensitivity, 70.8%; specificity, 59.8%) (Fig. 2B).

DISCUSSION

In this study, we successfully identified PTR at MUP as a predictor of the Q-tip angle. To our knowledge, this is the first article to demonstrate an association between these variables (Fig. 1C). However, only a fair correlation was found between PTR at MUP and the Q-tip angle (Spearman ρ=-0.28, Table 2); thus, PTR at MUP was not found to be an effective surrogate for the Q-tip test (Fig. 2B).
While urodynamic studies are not helpful for determining the surgical outcomes of uncomplicated SUI cases [17], these studies can be used to assess complicated cases. The urethral pressure profile is a component of urodynamic studies. Because PTR at MUP was significantly correlated with the Q-tip angle (ρ=-0.28) (Fig. 1C), a urethral pressure profile study might be performed with stress (i.e., coughing) to obtain PTR data, especially for women with SUI who do not undergo Q-tip testing. An increase in PTR at MUP has been reported as an important finding associated with the resolution of USI after midurethral surgery [16].
In the present study, point Ba was significantly correlated with the Q-tip angle (ρ=0.34; regression coefficient, 4.5; Tables 2 and 3), and point Ba was strongly correlated with point Aa (ρ=0.998, P<0.0001). Similarly, Zyczynski et al. [18] found a moderate correlation between point Aa and the Q-tip angle (r=0.35, P<0.001). Cogan et al. [19] also found that urethral hypermobility was present in ≥95% of patients with stage II or higher anterior compartment prolapse. Additionally, Walters et al. [20] reported that anterior vaginal relaxation was positively associated with the Q-tip angle (r=0.34, P=0.001).
In this study, Qmax (regression coefficient, 0.13) was found to be a predictor of the Q-tip angle (Table 3). We did not find any previous report with similar findings, and the underlying mechanism is unknown. However, owing to the presence of only a fair correlation (ρ=0.28, P=0.0001) (Table 2), Qmax is not an effective surrogate for the Q-tip test.
Age was found to be negatively correlated with the Q-tip angle in this study (ρ=-0.38, P<0.0001) (Table 2) (regression coefficient, -0.55; P<0.001) (Table 3). The underlying mechanism is unknown; however, the strength of abdominal straining may decrease in older women, which might explain the correlation between age and the Q-tip angle. It is worth mentioning that age was found to be positively correlated with the Q-tip angle (r=0.27, P<0.05) by Walters et al. [20].
IIQQ5 asks “Has urine leakage affected your participation in social activities outside your home?”. In this study, IIQQ5 score (range, 0–3) was an independent predictor of the Q-tip angle (regression coefficient, -4.1). The underlying mechanism of this relationship is unknown. However, a positive correlation was found between IIQQ5 and the presence of overactive bladder syndrome (ρ=0.31, P=0.0001) and incontinence episodes (ρ= 0.32, P=0.01), but not SUI (ρ=-0.02, P=0.77) or USI (ρ= 0.07, P=0.39). The above findings may indicate that female patients with overactive bladder syndrome and urgency incontinence have a smaller Q-tip angle (regression coefficient, -4.1).
Because urethral discomfort can occur during Q-tip testing, some authors have tried to substitute it with other surrogates [21-24]. Meyer et al. [21] used a vaginal swab test to predict urethral hypermobility; however, 11 of 80 results (13.8%) were found to be false negatives. Robinson et al. [22] used a visual urethral mobility exam to predict urethral hypermobility; however, the visual urethral mobility exam only contains binomial data (i.e., the presence or absence of urethral hypermobility), not continuous data. In contrast, the Q-tip angle is a continuous variable. A higher Q-tip angle has been reported to be associated with a higher success rate of midurethral sling surgery [2-4]; thus, owing to its binomial nature, a visual urethral mobility exam may not be as effective as the Q-tip test in predicting surgical outcomes. In addition, sonography-derived bladder neck movement has been used to assess urethral hypermobility [23]; however, poor interobserver correlation of sonography-derived bladder neck movement (r=0.43) was found compared with the interobserver correlation of the Q-tip test (r=0.83) [24].
In this study, the cough stress test was performed before the Q-tip test during the pelvic examination. Thus, our patients were asked to have some urine in the bladder before the cough stress test, especially in the cases of women with involuntary urine leakage. Therefore, most Q-tip tests were performed while the patient had some urine in the bladder (i.e., the bladder filling state). Nonetheless, it is worth mentioning that, in the supine position, the bladder filling state was reported to be associated with a higher Q-tip angle than the emptying state (15.4°±9.7° vs. 14.1°±9.1°, respectively; P=0.049) [6].
The limitations of this study include its retrospective nature. However, the optimal Q-tip angle of ≥32° for the prediction of USI in our results is similar to the conventional Q-tip angle of >30° for predicting urethral hypermobility. In addition, detailed data from a pelvic examination, urodynamic studies, questionnaires, and a 3-day bladder diary were reviewed in this study, which may make our data more reliable.
In conclusions, age, point Ba, USI, Qmax, PTR at MUP, and IIQQ5 were found to be independent predictors of the Q-tip angle. However, none of these can serve as effective surrogates for the Q-tip test due to their lack of a sufficient correlation.

NOTES

Research Ethics
This study was approved by the research ethics review committee of the Far Eastern Memorial Hospital (106060-E.), which waived the requirement for informed consent from patient.
Conflict of Interest
No potential conflict of interest relevant to this article was reported.
AUTHOR CONTRIBUTION STATEMENT
· Conceptualization: SMH
· Formal Analysis: SMH
· Investigation: HHL, WHT
· Methodology: SMH
· Project Administration: SMH
· Writing – Original Draft: CJW, SMH
· Writing – Review & Editing: SMH

REFERENCES

1. Crystle CD, Charme LS, Copeland WE. Q-tip test in stress urinary incontinence. Obstet Gynecol 1971;38:313-5. PMID: 5105346
pmid
2. Kim SO, Jung HS, Jang WS, Hwang IS, Yu HS, Kwon D. Measurement of the Q-tip angle before and after tension-free vaginal tapeobturator (TVT-O): preoperative urethral mobility may predict surgical outcome. Int Urogynecol J 2013;24:1005-9. PMID: 23152048
crossref pmid pdf
3. Toledo LG, Cabral PH, Casella ML, Politi GE, Cardoso SN, Mello LF, et al. Prognostic value of urethral mobility and valsalva leak point pressure for female transobturator sling procedure. Int Braz J Urol 2012;38:667-73. PMID: 23131507
crossref pmid pdf
4. Bakas P, Liapis A, Creatsas G. Q-tip test and tension-free vaginal tape in the management of female patients with genuine stress incontinence. Gynecol Obstet Invest 2002;53:170-3. PMID: 12053102
crossref pmid
5. Swift S, Barnes D, Herron A, Goodnight W. Test-retest reliability of the cotton swab (Q-tip) test in the evaluation of the incontinent female. Int Urogynecol J 2010;21:963-7. PMID: 20379698
crossref pmid pdf
6. Yun JH, Kim JH, Park S, Lee C. Changes in the Q-tip angle in relation to the patient position and bladder filling. BMC Urol 2015;15:101. PMID: 26446765
crossref pmid pmc
7. Karram MM, Bhatia NN. The Q-tip test: standardization of the technique and its interpretation in women with urinary incontinence. Obstet Gynecol 1988;71(6 Pt 1):807-11. PMID: 3368164
pmid
8. Harmanli OH, Okafor O, Ayaz R, Knee A. Lidocaine jelly and plain aqueous gel for urethral straight catheterization and the Q-tip test: a randomized controlled trial. Obstet Gynecol 2009;114:547-50. crossref
9. Haylen BT, de Ridder D, Freeman RM, Swift SE, Berghmans B, Lee J, et al. An International Urogynecological Association (IUGA)/International Continence Society (ICS) joint report on the terminology for female pelvic floor dysfunction. Int Urogynecol J 2010;21:5-26. PMID: 19937315
crossref pmid
10. Walters MD, Karram MM, editors. Urogynecology and reconstructive pelvic surgery. 3rd ed. Philadelphia (PA): Elsevier; 2007.
11. Sand PK, Ostergard DR, editors. Urodynamics and the evaluation of female incontinence: a practical guide. London: Springer-Verlag; 1995.
12. Wu WY, Sheu BC, Lin HH. Comparison of 20-minute pad test versus 1-hour pad test in women with stress urinary incontinence. Urology 2006;68:764-8. PMID: 17070349
crossref pmid
13. Hsiao SM, Hsiao CF, Chen CH, Chang TC, Wu WY, Lin HH. Evaluation of bladder diary parameters based on correlation with the volume at strong desire to void in filling cystometry. PLoS One 2013;8:e69946. PMID: 23922866
crossref pmid pmc
14. Hsiao SM, Lin HH, Kuo HC. Videourodynamic studies of women with voiding dysfunction. Sci Rep 2017;7:6845. crossref pdf
15. Gammie A, Kaper M, Dorrepaal C, Kos T, Abrams P. Signs and symptoms of detrusor underactivity: an analysis of clinical presentation and urodynamic tests from a large group of patients undergoing pressure flow studies. Eur Urol 2016;69:361-9. PMID: 26318706
crossref pmid
16. Hsiao SM, Sheu BC, Lin HH. Sequential assessment of urodynamic findings before and after transobturator tape procedure for female urodynamic stress incontinence. Int Urogynecol J Pelvic Floor Dysfunct 2008;19:627-32. PMID: 17928931
crossref pmid pdf
17. Nager CW, Brubaker L, Litman HJ, Zyczynski HM, Varner RE, Amundsen C, et al. A randomized trial of urodynamic testing before stress-incontinence surgery. N Engl J Med 2012;366:1987-97. crossref
18. Zyczynski HM, Lloyd LK, Kenton K, Menefee S, Boreham M, Stoddard AM, et al. Correlation of Q-tip values and point Aa in stress-incontinent women. Obstet Gynecol 2007;110:39-43. PMID: 17601894
crossref pmid
19. Cogan SL, Weber AM, Hammel JP. Is urethral mobility really being assessed by the pelvic organ prolapse quantification (POP-Q) system? Obstet Gynecol 2002;99:473-6. PMID: 11864676
crossref pmid
20. Walters MD, Diaz K. Q-tip test: a study of continent and incontinent women. Obstet Gynecol 1987;70:208-11. PMID: 3601284
pmid
21. Meyer I, Szychowski JM, Illston JD, Parden AM, Richter HE. Vaginal swab test compared with the urethral q-tip test for urethral mobility measurement: a randomized controlled trial. Obstet Gynecol 2016;127:348-52. PMID: 26942364
crossref pmid pmc
22. Robinson BL, Geller EJ, Parnell BA, Crane AK, Jannelli ML, Wells EC, et al. Diagnostic accuracy of visual urethral mobility exam versus Q-Tip test: a randomized crossover trial. Am J Obstet Gynecol 2012;206:528.e1-6. crossref
23. Schaer GN, Perucchini D, Munz E, Peschers U, Koechli OR, Delancey JO. Sonographic evaluation of the bladder neck in continent and stress-incontinent women. Obstet Gynecol 1999;93:412-6. PMID: 10074990
crossref pmid
24. Salvatore S, Serati M, Uccella S, Koelbl H, Artibani W, Cardozo L, et al. Inter-observer reliability of three different methods of measuring urethrovesical mobility. Int Urogynecol J Pelvic Floor Dysfunct 2008;19:1513-7. PMID: 18604464
crossref pmid pdf

Fig. 1.
(A) Comparisons of Q-tip angle between the urodynamic stress urinary incontinence (USI) and non-USI groups. Some points are not within the largest and smallest observations in the box plots, and are considered as outliers. (B) The receiver operating characteristic curves (ROC) of using Q-tip angle to predict USI. (C) Scatter fit plots of Q-tip angle and pressure transmission ratio (PTR) at maximum urethral pressure (MUP). CI, confidence interval.
inj-1938156-078f1.jpg
Fig. 2.
(A) Comparisons of pressure transmission ratio (PTR) at maximum urethral pressure (MUP) between the urodynamic stress urinary incontinence (USI) and non-USI groups. Some points are not within the largest and smallest observations in the box plots, and are considered as outliers. (B)The receiver operating characteristic curves (ROC) of using PTR at maximum urethral pressure to predict USI.
inj-1938156-078f2.jpg
Table 1.
Baseline data of women with lower urinary tract symptoms (n=176)
Variable Value
Age (yr) 58.1 ± 12.7
Parity 2.6 ± 1.2
Q-tip angle (°) 43.1 ± 22.5
POP-Q
 Aa -1.5 ± 2.1
 Ba -1.4 ± 2.4
 C -5.0 ± 4.0
Clinical diagnosis
 Stress urinary incontinence 102 (58)
 Overactive bladder syndrome 70 (40)
 Pelvic organ prolapse 40 (23)
 Voiding dysfunction 7 (4)
Urodynamic diagnosis
 Urodynamic stress urinary incontinence 112 (64)
 Bladder oversensitivity 92 (52)
 Detrusor overactivity 41 (23)
 Bladder outlet obstruction 10 (6)
Pad weight (g) 47.7 ± 64.6
Qmax (mL/sec) 26.6 ± 22.5
Voided volume (mL) 278 ± 160
Postvoid residual (mL) 104 ± 85
Voiding time (sec) 29 ± 24
Strong desire (mL) 286 ± 111
PdetQmax (cm H2O) 36.5 ± 26.2
MUCP (cm H2O) 63.4 ± 31.1
Functional profile length (cm) 2.5 ± 1.9
PTR at MUP (%) 85.6 ± 44.5
UDI 6.3 ± 3.4
IIQ 6.5 ± 5.2
Daytime frequency (72 hr) 25.1 ± 8.7
Nocturia (72 hr) 4.6 ± 3.0
Urgency (72 hr) 9.2 ± 11.7
Incontinence (72 hr) 3.5 ± 8.9
Total voided volume (mL, 72 hr) 5,630 ± 2,233
Average voided volume (mL) 198 ± 78

Values are expressed as the mean±standard deviation or number (%).

POP-Q, pelvic organ prolapse quantification system; Qmax, maximum flow rate; PdetQmax, detrusor pressure at maximum flow rate; MUCP, maximum urethral closure pressure; PTR, pressure transmission ratio; MUP, maximum urethral pressure; UDI, Urogenital Distress Inventory Questionnaire, Short Form; IIQ, Incontinence Impact Questionnaire, Short Form.

Table 2.
Correlations of Q-tip angle with clinical and urodynamic variables (n=176)
Variable Spearman rho P-value
Age (yr) -0.38 < 0.0001
Parity -0.19 0.01
 Aa 0.34 < 0.0001
 Ba 0.34 < 0.0001
 C 0.18 0.02
Clinical diagnosis
 Stress urinary incontinence 0.23 0.002
 Overactive bladder syndrome -0.25 0.001
 Pelvic organ prolapse -0.01 0.93
 Voiding dysfunction -0.15 0.04
Urodynamic diagnosis
 Urodynamic stress urinary incontinence 0.32 < 0.0001
 Bladder oversensitivity -0.09 0.22
 Detrusor overactivity -0.24 0.001
 Bladder outlet obstruction -0.09 0.24
Pad weight (g) 0.19 0.01
Qmax (mL/sec) 0.28 0.0001
Voided volume (mL) 0.18 0.02
Postvoid residual (mL) -0.09 0.22
Voiding time (sec) -0.05 0.52
Strong desire (mL) 0.1 0.19
PdetQmax (cm H2O) -0.02 0.82
MUCP (cm H2O) 0.15 0.05
Functional profile length (cm) -0.08 0.28
PTR at MUP (%) -0.28 0.0002
UDI 0.04 0.6
UDIQ3a) (0–3) 0.17 0.03
IIQ -0.08 0.3
IIQQ5a) (0–3) -0.23 0.003
Daytime frequency (72 hr) 0.1 0.44
Nocturia (72 hr) -0.01 0.95
Urgency (72 hr) -0.06 0.65
Incontinence (72 hr) -0.18 0.17
Total voided volume (mL, 72 hr) 0.09 0.48
Average voided volume (mL) -0.01 0.95

POP-Q, pelvic organ prolapse quantification system; Qmax, maximum flow rate; PdetQmax, detrusor pressure at maximum flow rate; MUCP, maximum urethral closure pressure; PTR, pressure transmission ratio; MUP, maximum urethral pressure; UDI, Urogenital Distress Inventory Questionnaire, Short Form; UDIQ3, the score of the third question in the UDI questionnaire; IIQ, Incontinence Impact Questionnaire, Short Form; IIQQ5, the score of the fifth question in the IIQ questionnaire.

a) Only the scores of the questions in the UDI and IIQ Questionnaires, which were significantly correlated to the Q-tip angle, were shown here.

Table 3.
Clinical and urodynamic factors to predict Q-tip angle (n=176)
Variable Multivariable analysis
Coefficient (degree, 95% CI) P-valuea)
Age (yr) -0.55 (-0.80 to -0.32) < 0.001
Ba 4.1 (2.8–5.4) < 0.001
Urodynamic stress urinary incontinence 9.9 (3.7–16.0) 0.002
Qmax (mL/sec) 0.13 (0.01–0.26) 0.036
PTR at MUP (%) -0.14 (-0.21 to -0.07) < 0.001
IIQQ5 (0–3) -4.1 (-7.1 to -1.1) 0.008
Constant 87.0 (69.5–104.5) < 0.001

CI, confidence interval; Qmax, maximum flow rate; PTR, pressure transmission ratio; MUP, maximum urethral pressure; IIQQ5, the score of the fifth question in the IIQ questionnaire.

a) Multivariable backward stepwise linear regression using all statistically significant variables (P<0.05) in Table 2. Herein, those variables without statistical significance were not shown.

R2=0.42.

TOOLS
Share :
Facebook Twitter Linked In Google+
METRICS Graph View
  • 3 Web of Science
  • 4 Crossref
  • 3 Scopus
  • 4,265 View
  • 85 Download
We recommend


ARTICLE & ORGAN
Article Category

Browse all articles >

Organ

Browse all articles >

ISSUES
DISEASES & TOPICS
Diseases

Browse all articles >

Topics

Browse all articles >

AUTHOR
INFORMATION

Official Journal of Korean Continence Society & ESSIC (International Society for the Study of BPS) & Korean Society of Urological Research & The Korean Children’s Continence and Enuresis Society & The Korean Association of Urogenital Tract Infection and Inflammation & Korean Society of Geriatric Urological Care
Editorial Office
Department of Urology, Kangbuk Samsung Medical Center, Sungkyunkwan University School of Medicine,
29 Saemunan-ro, Jongno-gu, Seoul 03181, Korea
Tel: +82-2-2001-2237     Fax: +82-2-2001-2247    E-mail: choys1011@naver.com

Copyright © 2024 by Korean Continence Society.

Developed in M2PI

Close layer
prev next