INJ Search

CLOSE


Int Neurourol J > Volume 23(2); 2019 > Article
Moon, Chung, Yu, Ko, Choi, Kwon, Lee, and Cho: The Association Between Obesity and the Nocturia in the U.S. Population

ABSTRACT

Purpose

We aimed to investigate the association of obesity with nocturia using a nationally representative sample of adults from the National Health and Nutrition Examination Survey (NHANES) between 2005 and 2012.

Methods

A total of 14,135 participants were included in this study. We performed a multivariate logistic regression analysis to find the odds ratio (OR) of obesity for nocturia. Furthermore, the OR of BMI for nocturia was analyzed using restricted cubic splines (RCS) with five knots. We conducted subgroup analysis according to age, sex, hypertension, and diabetes mellitus (DM) and further analysis with 1:1 matching data with propensity score.

Results

The participants who had body mass index (BMI) above 30 kg/m2 had a significantly higher OR for nocturia (OR, 1.39; 95% CI, 1.28–1.50) than those without obesity. RCS showed a dose-dependent relationship between BMI and OR for nocturia. Subgroup analysis by age, sex, hypertension, and DM showed similar results. Further analysis with 1:1 matching data showed a significant association of obesity with the prevalence of nocturia (OR, 1.25; 95% CI, 1.10–1.41).

Conclusions

This study reported that obesity was significant association with the prevalence of nocturia with dose-dependent manner, regardless of age, sex, hypertension, and DM after taking major confounding factors into account.

INTRODUCTION

Nocturia is considered to have a negative impact on quality of life due to bothersome storage symptom and is a highly prevalent [1]. Although the International Continence Society (ICS) defined nocturia as the frequent need to wake up at night to void [2], waking to void once every night could be normal, that most people who void less than two times during the night generally do not feel any discomfort during urination, and that adults normally rise no more than twice at night to void. Moreover, nocturia has been associated with more severe conditions when waking up during the night to void occurs two or more times in their daily life [3].
The pathophysiology of nocturia is varied and difficult to ascertain. Generally, the 2 main causes of nocturia are excessive amounts of urine produced during the night and reduced nocturnal bladder capacity [4]. Recently, nocturia has been associated with circadian dysfunction [5]. The underlying causes may be divided into 2 broad categories, urologic or nonurologic origin [6]. Urologic origin refers to lower urinary tract symptoms, including benign prostatic hyperplasia (BPH) and overactive bladder (OAB). By contrast, obesity, sleeping status, glucose intolerance, hypertension, cardiac disease, central nervous system (CNS) disorder, and depression are correlated with nocturia in nonurologic origin [4]. Among the various nonurologic origins, obesity is not only a risk factor for other related causes, such as glucose intolerance, hypertension, cardiac disease, and CNS disorder, but is also relatively reversible. Therefore, investigating the correlation between obesity and nocturia is important in order to improve patients’ quality of life by alleviating nocturia. A number of epidemiological studies have reported that the prevalence of nocturia is higher among obese patients than among nonobese patients [4,7,8]. In particular, many studies have reported that body mass index (BMI) was positively associated with nocturia in the general population [7,9]. However, some studies did not show such a positive association [10,11]. In addition, considering the heterogeneity of age, sex ratio, and various comorbidity between these studies, the association of obesity with nocturia remains unclear. Therefore, large population-based studies with subgroup analysis by stratification of major confounding factors are warranted.
Hence, we aimed to investigate the association of obesity with nocturia with subgroup analysis using the National Health and Nutrition Examination Survey (NHANES) data, which included a representative sample of adults from the United States.

MATERIALS AND METHODS

Study Participants

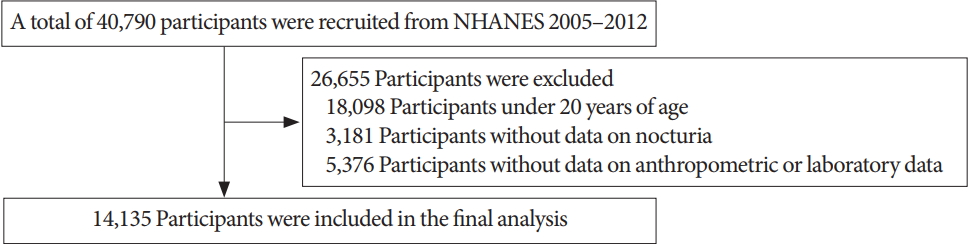
We used NHANES dataset from 2005 to 2012. The NHANES is a survey research program with a representative sample of adults from the United States, carried out by the National Center for Health Statistics [12] since 1999, The NHANES is biannually conducted and each cycle included approximately 5,000 persons from 15 areas. The NHANES data is consist of questionnaire-based personal interviews, physical examinations and laboratory tests. More detailed information of sampling design and data collection have been previously described [13]. Among 40,790 participants, 14,135 adults with essential data, such as nocturia questionnaire data, anthropometric data, and laboratory data were included in the present study (Fig. 1).

Definition of Nocturia and Comorbidity

We used World Health Organization criteria for obesity, which defined obesity as a BMI above 30 kg/m2. We classified the smoking status as ≥100 cigarettes in life and alcohol intake as ≥12 alcohol drinks in 1 year. To define hypertension, we used the average values of the 3 recorded blood pressure (BP) in the sitting position after 5 minutes of rest. Hypertension was defined as any of the following: the average values of the three recorded systolic BP above 140 mmHg, average diastolic BP above 90 mmHg, or having hypertension treatment. We used glucose concentration and hemoglobin A1c (HbA1c) to define diabetes mellitus (DM). The NHANES 2005–2006 used a Roche 911 analyzer (Roche, Basel, Switzerland) to measure glucose concentration and a Tosoh A1c 2.2 Plus Glycohemoglobin Analyzer (Tosoh Medics, Inc., San Francisco, CA, USA) to measure HbA1c. NHANES 2007–2012 used a Roche/Hitachi modular P chemistry analyzer (Roche Diagnostics GmbH, Mannheim, Germany) and A1c G7 HPLC Glycohemoglobin Analyzer (Tosoh Medics, Inc., San Francisco, CA, USA), respectively. The definition of DM in our study was as any of the following: fasting glucose above 126 mg/dL, HbA1c above 6.5%, random glucose above 200 mg/dL or having DM treatment. Fasting total cholesterol concentration was measured using a Hitachi 912 analyzer (Hitachi, Tokyo, Japan) in NHANES 2005–2006 and a Roche/Hitachi modular P chemistry analyzer in NHANES 2007–2012. We defined dyslipidemia as any of the following: fasting total cholesterol above 240 mg/dL or having dyslipidemia treatment. The data of BPH was only available in NHANES 2005–2008. BPH was defined using a structured questionnaire. Those who answered “yes” of the following questions: “Have you ever been told by a doctor or health professional that you had an enlarged prostate gland” and “Was it a benign enlargement?”
We defined Nocturia using a structured urologic questionnaire. Those who answered “two or more” of the following question considered to have nocturia: “During the past 30 days, how many times per night did you most typically get up to urinate, from the time you went to bed at night until the time you got up in the morning?”

Statistical analysis

The mean with a standard deviation or prevalence (%) by nocturia status was presented with P-value using t-test and the Pearson chi-square test. Considering the previous reports of the effect of various components on nocturia, we conducted multivariate logistic regression analysis adjusted for age, sex, race/ethnicity, sleep duration, smoking status, alcohol intake, DM, hypertension, dyslipidemia, estimated glomerular filtration rate (eGFR), and albumin creatinine ratio (ACR) to find the independent odds ratio (OR) of BMI or obesity for nocturia existing as the binary outcome variable [14-16]. Furthermore, the OR of BMI for nocturia was analyzed using restricted cubic splines (RCS) with five knots. Considering the heterogeneity in baseline data by nocturia prevalence, we conducted subgroup analysis according to age, sex, hypertension and DM. In addition, to minimize the possible bias arising from the heterogeneity, we conducted multivariable logistic regression analysis after 1:1 propensity score matching. Propensity score matching was performed by the nearest neighbor method using package “MatchIt” [17]. The variables selected for the propensity score matching included age, sex, race/ethnicity, smoking status, DM, hypertension, dyslipidemia, ACR, and eGFR. We used the R ver. 3.1.0 (R Foundation for Statistical Computing, Vienna, Austria; www.r-project.org) and IBM SPSS Statistics ver. 24.0 (IBM Co., Armonk, NY, USA) for the analysis.

RESULTS

Baseline Characteristics

A total of 14,135 participants (men; 6,947, women; 7,188), aged 20–85 years were analyzed (Fig. 1). The prevalence of nocturia was 32.7% (men, 30.5%; women, 34.9%). Table 1 showed the baseline characteristics in this study according to nocturia status. Participants with nocturia were old and commonly women, and have hypertension, DM, and dyslipidemia compared with normal participants. Because of the heterogeneity between normal and nocturia group, we used 1:1 propensity score matching data. Their baseline characteristics were also summarized in Table 1.

Association of Obesity With Nocturia

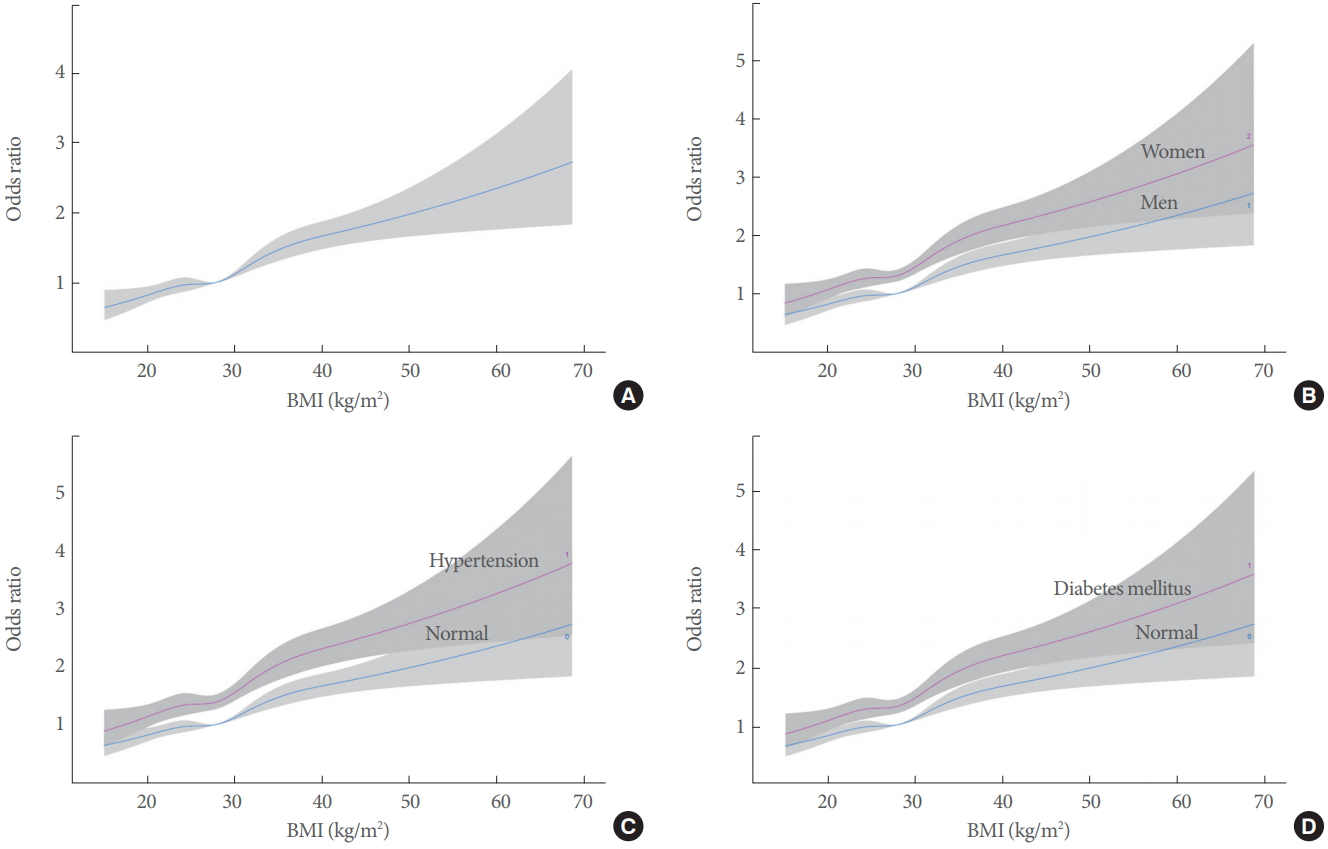
A significantly association between BMI increase and the prevalence of nocturia was founded (OR, 1.03; 95% CI, 1.02–1.04) (Table 2). Those who had a BMI above 30 kg/m2 had a significantly higher OR for nocturia (OR, 1.39; 95% CI, 1.28–1.50) (Table 2). The RCS showed a dose-dependent increase of OR for nocturia by BMI (Fig. 2). Subgroup analysis showed a similar result regardless of age, sex, hypertension or DM (Fig. 3). Further analysis with 1:1 matching data with propensity score showed a significant association of BMI increase and obesity with the prevalence of nocturia (BMI: OR, 1.02; 95% CI, 1.01–1.03; obesity: OR, 1.25; 95% CI, 1.10–1.41) (Table 3).

DISCUSSION

Our study demonstrates a significant association of obesity with nocturia with a nationally representative population-based prevalence estimates in the United States. To our knowledge, our study is one of the largest studies with nationally representative sample. In this study, we were able to confirm the previously established relationship between obesity and nocturia with subgroup analyses stratified by age, sex, and underlying diseases [9,18-23].
Our study reported that 32.7% of the participants (men, 30.5%; women, 34.9%) had nocturia occurring 2 or more times per night. Data from NHANES 1988–1994 showed that the prevalence of nocturia (≥2 times at night) was 15.5% in men and 20.9% in women [24]. A recent study in men using data form NHANES 2005–2008 reported that the prevalence of nocturia increased by 21% [25]. Our finding shows that the prevalence of nocturia has increased during the last two decades in the United States. A reason for continuous increase in the rate of nocturia prevalence over time may be due to the rapidly aging population [26].
We analyzed not only the prevalence of nocturia, but also the association between nocturia and clinical characteristics. Numerous studies have demonstrated various correlates such as age, race, hypertension, DM, and stroke for nocturia [4,21,22,25,27]. Our study has shown that patients with nocturia tended to be older women with hypertension, DM, and dyslipidemia. The results of the present analysis of the association of nocturia among men and women are consistent with those reported in previous population-based epidemiological studies [4].
Notably, the present study found a significant association between BMI and nocturia by a dose-dependent pattern. This result was consistent with those reported in previous studies [4,9,18-23]. One of the main strengths in our study was that various subgroup analyses were conducted. In the subgroup analyses by stratification of age, the present study found a significant association between obesity and nocturia in both young and old subgroups. Considering the increasing prevalence of nocturia by aging, a subgroup analysis by age is important because the results are derived after reducing the confounding effects of age. Interestingly, previous studies reported differences with regard to sex in the association of obesity with the prevalence of nocturia [9,22,23]. Many studies reported that women have a stronger association of BMI increase with nocturia than men have [9,22]. Our findings observed the positive association between BMI increase and nocturia in both sexes but the OR in women was higher than that in men. This finding is consistent with those reported in previous studies.
Although patients with DM had higher prevalence of obesity and nocturia than those without DM, only limited evidence exist regarding the association between obesity and nocturia in patients with DM. Chung et al. [16] showed a significantly high OR for nocturia in obese patients with DM in Taiwan whereas Chiu et al. [28] reported insignificant result in another Taiwanese study. Furukawa et al. [7] reported a significantly high OR for nocturia in obese elderly patients with DM in Japan. The present study is also relevant because it used large population data to additionally investigate the dose-dependent correlation of BMI with nocturia in DM patients.
Another strength of the study is that an analysis was performed using an age- and sex-matched control group. Because the nocturia patient group comprised more elderly women, correcting this discrepancy can provide more valid results for the correlation between BMI and nocturia.
The mechanism of association between obesity and nocturia has not yet been clearly determined. Obesity can cause nocturia by increasing urine production or increasing frequency of urination. A possible mechanism of nocturia is that some obese people can increase the production of urine at night with excessive nighttime eating or drinking, especially drinking alcohol [9]. In addition, those with central obesity may have increased intraabdominal pressure, leading to nocturia [29]. Among men, it is known that prostate size or prostate growth rate is positively related to obesity [9]. Therefore, obesity may also increase the risk of nocturia by causing BPH [30]. Other evidence for the mechanism linking obesity and nocturia has been found in several studies reporting an association between weight loss and improvements in nocturia. A randomized clinical trial study with overweight or obese women showed that the incidence of nocturia reduced more in a behavioral weight-reduction intervention group than a control group, over a period of 6 months [31]. In addition, another study reported that a 52-week longterm exercise program improved the BMI and nocturia [32] in obese elderly women.
The present study found a significant association between BMI and nocturia in a dose-dependent pattern regardless of age, sex, hypertension, and DM. However, there were several potential limitations in this study. First, because this study was cross-sectional, further prospective studies are necessary to find the causality between nocturia and obesity. Second, considering our study excluded most participants in NHANES due to lack of data, there might be selection bias. Third, although propensity score matching method was performed to adjust the randomization effects between nocturia groups and control groups, not all variables were adjusted.
In conclusion, this study reported that high BMI and obesity were significantly associated with the prevalence of nocturia in men and women after taking major confounding factors into account. A dose-dependent pattern of increased BMI with increasing prevalence of nocturia was also observed. These findings indicate that greater BMI was significantly associated with increased prevalence of nocturia. Furthermore, the results provide a better understanding of the underlying mechanisms of nocturia from the observed association between nocturia and obesity.

NOTES

Fund/Grant Support
This study was supported by Hallym University Research Fund 2017 (HURF-2017-53).
Research Ethics
The National Center for Health Statistics Research Ethics Review Board approved NHANES (Protocol #2005-06 and Protocol #2011-17).
Conflict of Interest
No potential conflict of interest relevant to this article was reported.
AUTHOR CONTRIBUTION STATEMENT
·Full access to all the data in the study and takes responsibility for the integrity of the data and the accuracy of the data analysis: SM, STC, YGL, JY, HSC, KJK, DKC, OK
·Study concept and design: SM, STC
·Acquisition of data: SM, STC
·Analysis and interpretation of data: SM, STC
·Drafting of the manuscript: SM, STC
·Critical revision of the manuscript for important intellectual content: SM, STC, YGL, JY, HSC
·Statistical analysis: SM
·Obtained funding: STC
·Administrative, technical, or material support: SM, STC
·Study supervision: KJK, DKC, OK

REFERENCES

1. Zumrutbas AE, Bozkurt AI, Alkis O, Toktas C, Cetinel B, Aybek Z. The prevalence of nocturia and nocturnal polyuria: can new cutoff values be suggested according to age and sex? Int Neurourol J 2016;20:304-10. PMID: 28043108
crossref pmid pmc pdf
2. van Kerrebroeck P, Abrams P, Chaikin D, Donovan J, Fonda D, Jackson S, et al. The standardisation of terminology in nocturia: report from the Standardisation Sub-committee of the International Continence Society. Neurourol Urodyn 2002;21:179-83. PMID: 11857672
crossref pmid
3. Weiss JP, Blaivas JG, Blanker MH, Bliwise DL, Dmochowski RR, Drake M, et al. The New England Research Institutes, Inc. (NERI) Nocturia Advisory Conference 2012: focus on outcomes of therapy. BJU Int 2013;111:700-16. PMID: 23360086
crossref pmid
4. Yoshimura K. Correlates for nocturia: a review of epidemiological studies. Int J Urol 2012;19:317-29. PMID: 22239551
crossref pmid
5. Kim JW, Moon YT, Kim KD. Nocturia: the circadian voiding disorder. Investig Clin Urol 2016;57:165-73. PMID: 27195315
crossref pmid pmc
6. Weiss JP. Nocturia: focus on etiology and consequences. Rev Urol 2012;14:48-55. PMID: 23526404
pmid pmc
7. Furukawa S, Sakai T, Niiya T, Miyaoka H, Miyake T, Yamamoto S, et al. Obesity and the prevalence of nocturia in Japanese elderly patients with type 2 diabetes mellitus: The Dogo study. Geriatr Gerontol Int 2017;17:2460-5. PMID: 28656733
crossref pmid
8. Lee YJ, Jeong SJ, Byun SS, Lee JJ, Han JW, Kim KW. Prevalence and correlates of nocturia in community-dwelling older men: results from the korean longitudinal study on health and aging. Korean J Urol 2012;53:263-7. PMID: 22536470
crossref pmid pmc
9. Tikkinen KA, Auvinen A, Huhtala H, Tammela TL. Nocturia and obesity: a population-based study in Finland. Am J Epidemiol 2006;163:1003-11. PMID: 16597705
crossref pmid pdf
10. Aoki Y, Yokoyama O. Metabolic syndrome and nocturia. Low Urin Tract Symptoms 2012;4 Suppl 1:11-5. PMID: 26676694
crossref pmid
11. Elia G, Dye TD, Scariati PD. Body mass index and urinary symptoms in women. Int Urogynecol J Pelvic Floor Dysfunct 2001;12:366-9. PMID: 11795637
crossref pmid pdf
12. The National Center for Health Statistics [Internet]. Atlanta (GA): Centers for Disease Control and Prevention; [updated 2019 Jun 3; cited 2019 Jun 3]. Available from: https://www.cdc.gov/nchs/nhanes/index.htm.
13. Johnson CL, Dohrmann SM, Burt VL, Mohadjer LK. National health and nutrition examination survey: sample design, 2011-2014. Vital Health Stat 2 2014;(162):1-33.
14. Chow PM, Liu SP, Chuang YC, Lee KS, Yoo TK, Liao L, et al. The prevalence and risk factors of nocturia in China, South Korea, and Taiwan: results from a cross-sectional, population-based study. World J Urol 2018;36:1853-62. PMID: 29796775
crossref pmid pdf
15. Dani H, Esdaille A, Weiss JP. Nocturia: aetiology and treatment in adults. Nat Rev Urol 2016;13:573-83. PMID: 27455894
crossref pmid pdf
16. Chung MS, Chuang YC, Lee JJ, Lee WC, Chancellor MB, Liu RT. Prevalence and associated risk factors of nocturia and subsequent mortality in 1,301 patients with type 2 diabetes. Int Urol Nephrol 2014;46:1269-75. PMID: 24595602
crossref pmid pdf
17. Ho DE, Imai K, King G, Stuart EA. MatchIt: nonparametric preprocessing for parametric causal inference. J Stat Softw 2011;42:1-28. crossref
18. Hsieh CH, Chen HY, Hsu CS, Chang ST, Chiang CD. Risk factors for nocturia in Taiwanese women aged 20-59 years. Taiwan J Obstet Gynecol 2007;46:166-70. PMID: 17638626
crossref pmid
19. Asplund R, Aberg HE. Nocturia in relation to body mass index, smoking and some other life-style factors in women. Climacteric 2004;7:267-73. PMID: 15669551
crossref pmid
20. Schatzl G, Temml C, Schmidbauer J, Dolezal B, Haidinger G, Madersbacher S. Cross-sectional study of nocturia in both sexes: analysis of a voluntary health screening project. Urology 2000;56:71-5. PMID: 10869627
crossref pmid
21. Fitzgerald MP, Litman HJ, Link CL, McKinlay JB; BACH Survey Investigators. The association of nocturia with cardiac disease, diabetes, body mass index, age and diuretic use: results from the BACH survey. J Urol 2007;177:1385-9. PMID: 17382738
crossref pmid
22. Burgio KL, Johnson TM 2nd, Goode PS, Markland AD, Richter HE, Roth DL, et al. Prevalence and correlates of nocturia in community-dwelling older adults. J Am Geriatr Soc 2010;58:861-6. PMID: 20406317
crossref pmid pmc
23. Choo MS, Ku JH, Park CH, Lee YS, Lee KS, Lee JG, et al. Prevalence of nocturia in a Korean population aged 40 to 89 years. Neurourol Urodyn 2008;27:60-4. PMID: 17565726
crossref pmid
24. Kupelian V, Fitzgerald MP, Kaplan SA, Norgaard JP, Chiu GR, Rosen RC. Association of nocturia and mortality: results from the Third National Health and Nutrition Examination Survey. J Urol 2011;185:571-7. PMID: 21168875
crossref pmid
25. Markland AD, Vaughan CP, Johnson TM 2nd, Goode PS, Redden DT, Burgio KL. Prevalence of nocturia in United States men: results from the National Health and Nutrition Examination Survey. J Urol 2011;185:998-1002. PMID: 21251675
crossref pmid
26. Appell RA, Sand PK. Nocturia: etiology, diagnosis, and treatment. Neurourol Urodyn 2008;27:34-9. PMID: 17924538
crossref pmid
27. Johnson TM 2nd, Sattin RW, Parmelee P, Fultz NH, Ouslander JG. Evaluating potentially modifiable risk factors for prevalent and incident nocturia in older adults. J Am Geriatr Soc 2005;53:1011-6. PMID: 53
crossref pmid pmc
28. Chiu AF, Huang MH, Wang CC, Kuo HC. Higher glycosylated hemoglobin levels increase the risk of overactive bladder syndrome in patients with type 2 diabetes mellitus. Int J Urol 2012;19:995-1001. PMID: 22774846
crossref pmid
29. Lee SH, Kim JC, Lee JY, Kim JH, Oh CY, Lee SW, et al. Effects of obesity on lower urinary tract symptoms in Korean BPH patients. Asian J Androl 2009;11:663-8. PMID: 19767763
crossref pmid pmc
30. Yoshimura K, Terada N, Matsui Y, Terai A, Kinukawa N, Arai Y. Prevalence of and risk factors for nocturia: Analysis of a health screening program. Int J Urol 2004;11:282-7. PMID: 15147543
crossref pmid
31. Breyer BN, Creasman JM, Richter HE, Myers D, Burgio KL, Wing RR, et al. A behavioral weight loss program and nonurinary incontinence lower urinary tract symptoms in overweight and obese women with urinary incontinence: a secondary data analysis of PRIDE. J Urol 2018;199:215-22. PMID: 28807645
crossref pmid
32. Ko IG, Lim MH, Choi PB, Kim KH, Jee YS. Effect of long-term exercise on voiding functions in obese elderly women. Int Neurourol J 2013;17:130-8. PMID: 24143292
crossref pmid pmc

Fig. 1.
Flowchart for participant selection. NHANES, National Health and Nutrition Examination Survey.
inj-1938062-031f1.jpg
Fig. 2.
Relationship between body mass index (BMI) and the odds ratio for nocturia according to sex, hypertension, and diabetes mellitus. (A) Total, (B) men vs. women, (C) normal vs. hypertension, and (D) normal vs. diabetes mellitus. Multivariate logistic regression model adjusted for age, sex, race/ethnicity, smoking, alcohol intake, sleep duration, hypertension, dyslipidemia, diabetes mellitus, albumin creatinine ratio, and estimated glomerular filtration rate
inj-1938062-031f2.jpg
Fig. 3.
The association between obesity and nocturia according to sex, hypertension (HTN), and diabetes mellitus (DM). a)NHANES 2005–2008 data was used due to limited data for benign prostatic hyperplasia (BPH). Multivariate logistic regression model adjusted for the following variables except for the factors for subgroup classification: age, sex, race/ethnicity, smoking, alcohol intake, sleep duration, HTN, dyslipidemia, DM, albumin creatinine ratio, and estimated glomerular filtration rate. OR, odds ratio; CI, confidence interval.
inj-1938062-031f3.jpg
Table 1.
Participants’ clinical characteristics obtained from the National Health and Nutrition Examination Survey dataset between 2005 and 2012
Characteristic Before propensity score matching
After propensity score matching
Normal (n = 9,507) Nocturia (n = 4,628) Dif P-value Normal (n = 4,628) Nocturia (n = 4,628) Dif P-value
Age (yr) 49.3 ± 16.8 59 ± 16.1 -0.585 < 0.001 59 ± 15.0 59 ± 16.1 0 0.976
Male sex 4,831 (50.8) 2,116 (45.7) < 0.001 2,119 (45.8) 2,116 (45.7) 0.967
Race/ethnicities < 0.001 < 0.001
 Mexican Hispanics 1,260 (13.3) 679 (14.7) 570 (12.3) 679 (14.7)
 Other Hispanics 825 (8.7) 408 (8.8) 396 (8.6) 408 (8.8)
 Non-Hispanic Whites 4,930 (51.9) 2,073 (44.8) 2,496 (53.9) 2,073 (44.8)
 Non-Hispanic Blacks 1,709 (18) 1,236 (26.7) 872 (18.8) 1,236 (26.7)
 Other race 783 (8.2) 232 (5) 294 (6.4) 232 (5)
Smoking (≥ 100 cigarettes in life) 4,251 (44.7) 2,351 (50.8) < 0.001 2,381 (51.4) 2,351 (50.8) 0.547
Alcohol intake (≥ 12 alcohol drinks in 1 yr) 7,726 (74.2) 3,209 (66) < 0.001 3,238 (70) 3,209 (66) < 0.001
Sleep duration (hr) 6.9 ± 1.3 6.8 ± 1.6 0.071 0.001 6.9 ± 1.4 6.8 ± 1.6 0.067 < 0.001
Body mass index (kg/m2) 28.8 ± 6.5 30.5 ± 7.0 -0.255 < 0.001 29.4 ± 6.6 30.5 ± 7.0 -0.162 < 0.001
Systolic blood pressure (mmHg) 122.7 ± 17.1 128.5 ± 20.3 -0.319 < 0.001 128.2 ± 19.0 128.5 ± 20.3 -0.015 0.495
Diastolic blood pressure (mmHg) 70.6 ± 12.1 69.4 ± 14.0 0.094 < 0.001 70 ± 13.3 69.4 ± 14.0 0.044 0.03
Fasting glucose (mg/dL) 107.3 ± 32.9 116.2 ± 43.7 -0.242 < 0.001 114.7 ± 39.3 116.2 ± 43.7 -0.036 0.235
HbA1c (%) 5.7 ± 1.0 6 ± 1.3 -0.271 < 0.001 5.9 ± 1.1 6 ± 1.3 -0.083 < 0.001
Total cholesterol (mg/dL) 199.8 ± 42.6 198.9 ± 46.4 0.021 0.251 200.7 ± 43.4 198.9 ± 46.4 0.04 0.049
Triglycerides (mg/dL) 135.6 ± 107.2 148.4 ± 123.8 -0.113 < 0.001 140.8 ± 106.4 148.4 ± 123.8 -0.066 0.025
HDL-cholesterol (mg/dL) 53 ± 15.9 53.3 ± 16.6 -0.019 0.241 53.5 ± 16.4 53.3 ± 16.6 0.012 0.536
ACR (mg/g) 33.7 ± 267.0 80.8 ± 516.9 -0.128 < 0.001 52.8 ± 369.6 80.8 ± 516.9 -0.062 0.003
eGFR 93.5 ± 25.0 87.7 ± 28.7 0.221 < 0.001 88.1 ± 25.8 87.7 ± 28.7 0.015 0.407
Diabetes mellitus 1,523 (16) 1,425 (30.8) < 0.001 1,291 (27.9) 1,425 (30.8) 0.002
Hypertension 4,231 (44.5) 3,146 (68) < 0.001 3,163 (68.3) 3,146 (68) 0.721
Dyslipidemia 4,785 (50.3) 2,949 (63.7) < 0.001 2,953 (63.8) 2,949 (63.7) 0.948

Values are presented as mean±standard deviation or number (%).

Normal, control group; Nocturia, nocturia group; HbA1c, hemoglobin A1c; HDL-C, high-density lipoprotein cholesterol; ACR, albumin creatinine ratio; eGFR, estimated glomerular filtration rate; Dif, standardized mean difference.

Table 2.
The association between obesity and nocturia
Model BMI
Obesity (BMI > 30 kg/m2)
OR (95% CI) P-value OR (95% CI) P-value
1 1.03 (1.03–1.04) < 0.001 1.55 (1.43–1.67) < 0.001
2 1.03 (1.02–1.04) < 0.001 1.39 (1.29–1.50) < 0.001
3 1.03 (1.02–1.04) < 0.001 1.39 (1.28–1.50) < 0.001

Model 1, multivariate logistic regression model adjusted for age, sex and race; model 2, multivariate logistic regression model adjusted for model 1 and dyslipidemia, hypertension, diabetes mellitus, sleep duration, smoking and alcohol intake; model 3, multivariate logistic regression model adjusted for model 2 and blood glucose, total cholesterol, albumin creatinine ratio, and estimated glomerular filtration rate; BMI, body mass index; OR, odds ratio; CI, confidence interval.

Table 3.
The association between obesity and nocturia in propensity score matching sample
Model BMI
Obesity (BMI > 30 kg/m2)
OR (95% CI) P-value OR (95% CI) P-value
1 1.02 (1.01–1.03) < 0.001 1.31 (1.20–1.42) < 0.001
2 1.02 (1.01–1.03) < 0.001 1.32 (1.21–1.44) < 0.001
3 1.02 (1.01–1.03) < 0.001 1.25 (1.10–1.41) 0.001

Model 1, multivariate logistic regression model adjusted for age, sex and race; model 2, multivariate logistic regression model adjusted for model 1 and dyslipidemia, hypertension, diabetes mellitus, sleep duration, smoking and alcohol intake; model 3, multivariate logistic regression model adjusted for model 2 and blood glucose, total cholesterol, albumin creatinine ratio, and estimated glomerular filtration rate; BMI, body mass index; OR, odds ratio; CI, confidence interval.

TOOLS
Share :
Facebook Twitter Linked In Google+
METRICS Graph View
  • 22 Web of Science
  • 22 Crossref
  • 22 Scopus
  • 5,610 View
  • 88 Download
We recommend


ARTICLE & ORGAN
Article Category

Browse all articles >

Organ

Browse all articles >

ISSUES
DISEASES & TOPICS
Diseases

Browse all articles >

Topics

Browse all articles >

AUTHOR
INFORMATION

Official Journal of Korean Continence Society & ESSIC (International Society for the Study of BPS) & Korean Society of Urological Research & The Korean Children’s Continence and Enuresis Society & The Korean Association of Urogenital Tract Infection and Inflammation & Korean Society of Geriatric Urological Care
Editorial Office
Department of Urology, Kangbuk Samsung Medical Center, Sungkyunkwan University School of Medicine,
29 Saemunan-ro, Jongno-gu, Seoul 03181, Korea
Tel: +82-2-2001-2237     Fax: +82-2-2001-2247    E-mail: choys1011@naver.com

Copyright © 2024 by Korean Continence Society.

Developed in M2PI

Close layer
prev next