


INTRODUCTION
Hospitals provide various tools to assist in the care of patients with dysuria, such as voiding charts. The voiding chart is described in textbooks as one of the most important diagnostic tools for dysuria [1-3]. It is a method that allows the doctor to observe the subjective symptoms of the patients in an objective way. Because diagnosis or treatment is carried out after the symptoms are observed objectively, this method is considered the starting point for studies of dysuria. As in the famous saying, “a patient reporting his symptoms is like a witness who cannot be trusted,” dysuric symptoms subjectively described by patients can be recounted differently depending on the patient’s personality and surroundings, even if the symptoms occur with equal frequency. Unlike history-taking, which is one of the most objective methods used to assess urinary symptoms, the voiding chart is used to make a complete diagnosis based on records collected from the patient’s daily activities. In other words, history-taking is used by doctors to observe the urinary symptoms of patients at a certain time, while the voiding chart is used to carry out a more thorough observation. The values of urination frequency or urination volume change may be irregular, showing significant variation according to factors such as body condition, liquid intake, and amount of physical activity. Therefore, the key to diagnosis is quickly identifying statistically meaningful changes in the overall frequency of urination.
However, because such voiding charts are recorded by patients similarly to how journal entries are recorded, they may contain inaccurate data. Even if patients are trained well, as in a clinical study, many studies have shown that the recorded data may be inaccurate [4-6]. In particular, because it is nearly impossible for children and elderly patients to record all variables, these patient groups are generally asked to only record their urination frequency. Moreover, there are many variables that can be evaluated using voiding charts, but it is clinically impossible to apply them to all patients. In other words, patient care is difficult because of the involvement of many variables in voiding charts, which is mainly due to the problem of patients having varying abilities to record their urination patterns themselves.
According to the International Continence Society, voiding charts are used in the following 3 forms [7-10]. A micturition time chart is used to observe the frequency and time distribution of urination over a single day by having children and elderly patients only indicate the time of their urination. A frequency volume chart is used to observe urination activity by having patients indicate not only the time of urination, but also the amount. A bladder diary is used to observe many variables at once, by having patients indicate the time of urination, the amount of urination, the time and amount of urinary incontinence, use of pads, and water intake. The bladder diary is used for patients (e.g., young adults) who are able to record their urination activities well. However, because there are so many variables involved in interpreting these records (largely due to the aforementioned issue of patients having varying abilities to record their activities), it is difficult for such voiding charts to provide accurate measurements of urinary activities. If such issues could be resolved, it would be possible to provide more systemic and efficient care to dysuric patients. Against this backdrop, the current trend is to develop plans to integrate information technology into these recording systems.
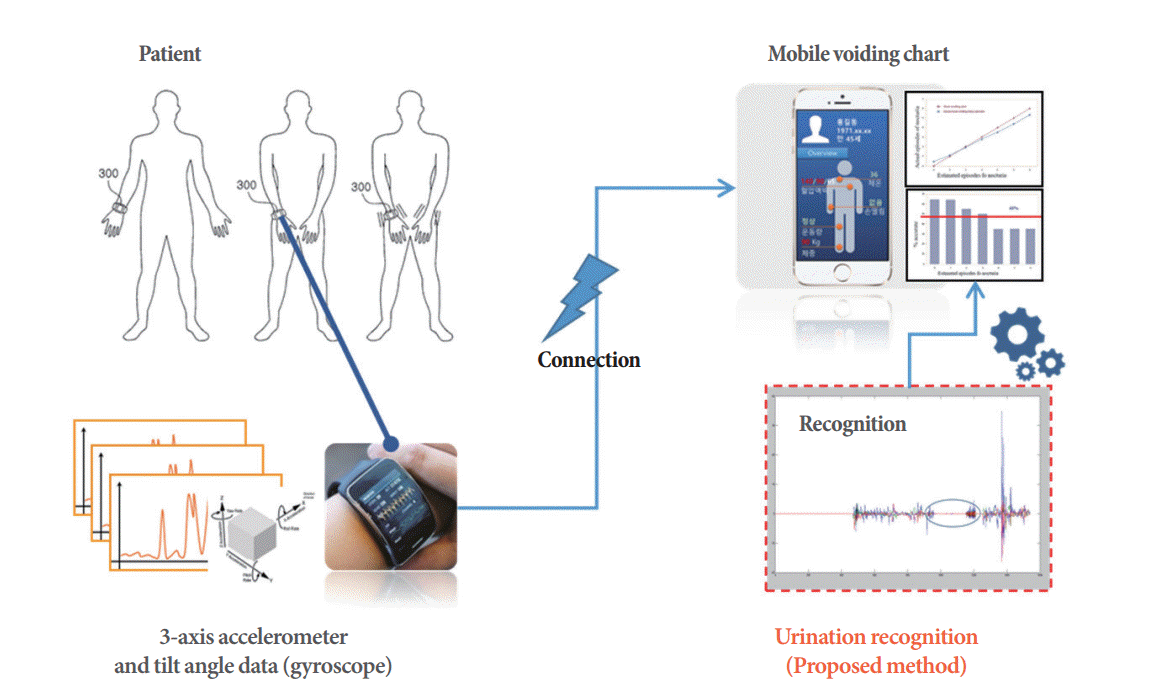
This study collected and analyzed activity (movement) data sensed through smart bands worn by patients. Through the development of technology that recognizes urination activity and frequency, this study aimed to examine the feasibility of urination monitoring systems. The urination recognition technology proposed in this study is an extension of pattern recognition technology based on existing signal processors. In general, the most common such services are those that alert users after recognizing an extracted pattern (e.g., a particular motion) in home care services. The proposed technology additionally recognizes the signal pattern of urination, in order to measure the frequency of urination and automatically record data regarding a patient’s urinary activities. To examine the feasibility of a urination monitoring system, the accuracy and feasibility of the urination recognition system were assessed. Existing pattern detection technology has mainly been developed in algorithms for the recognition of specific motions, such as falling. A variety of methods are in development, including a recognition technology that uses a 3-axis accelerometer and a tilt sensor to collect and analyze data [11,12], a recognition technology that takes into account an acceleration sensor and impact sounds [13], a recognition technology with a learning method based on neural networks in the image recognition field [14], and methods that develop distribution technology (e.g., support vector machines [SVMs] and hidden Markov models) and projection technology [15]. Research and development into such recognition methods have been in progress for a long time, and the methods have been improved in various ways to resolve inaccuracies in certain situations. Several techniques have been used to make improvements, such as adjusting the technology to best fit a particular application, adjusting the optimal threshold value to enhance accuracy, and adjusting the weighted values. Recently, deep-learning algorithm [16] research has become the trendiest learning method with the most accurate performance. However, the principal limitation of deep-learning technology is that it shows optimal performance only when conditions regarding the adequate quantity and quality of the data are satisfied. This study aimed to develop a recognition algorithm suitable for a field in which recognition technology has not yet been applied. To achieve this, the strengths of existing recognition technologies were utilized, and an algorithm recognizing the 3 stages of urination (forward movement, urination, and backward movement) was developed to examine the feasibility of urination monitoring.
MATERIALS AND METHODS
This study aimed to develop an algorithm that recognizes urination based on the patient’s posture or change in posture. The patient’s motion data were obtained from a smart band on the arm. An algorithm that recognizes the 3 stages of urination (forward movement, urination, and backward movement) was developed based on data collected from the 3-axis accelerometer and tilt angle data (gyroscope). Greater weight was put on the acceleration data than the tilt angle data in order to provide an automatic calculator of urination frequency. The conceptual diagram used for urination recognition was processed according to the following stages, shown in Fig. 1.
Development of Urination Recognition Technology
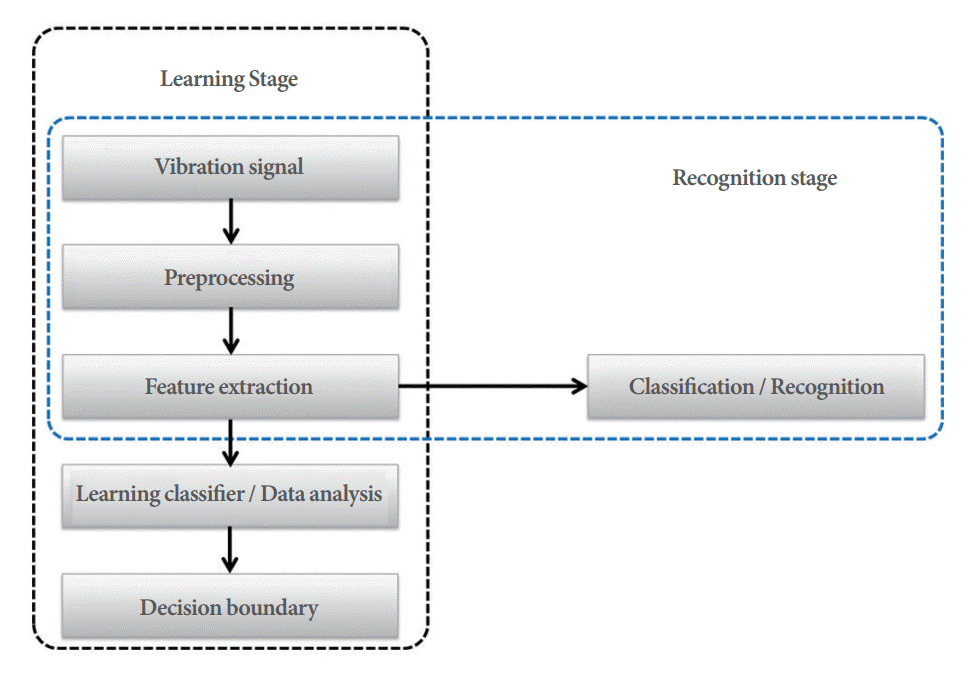
There are 2 main processing stages for pattern recognition using machine learning. First, in the learning stage, pattern characteristics are analyzed using data obtained from instances of the behavior to be modeled (for instance, falling), and key information for classifying different patterns is extracted. After completing the learning stage, newly obtained data are classified and recognized. Usually, the learning stage is carried out a single time during the production of the recognition technology, and the recognition stage is carried out every time new data are given. The proposed method used for urination recognition included the following stages, shown in Fig. 2.
Preprocessing
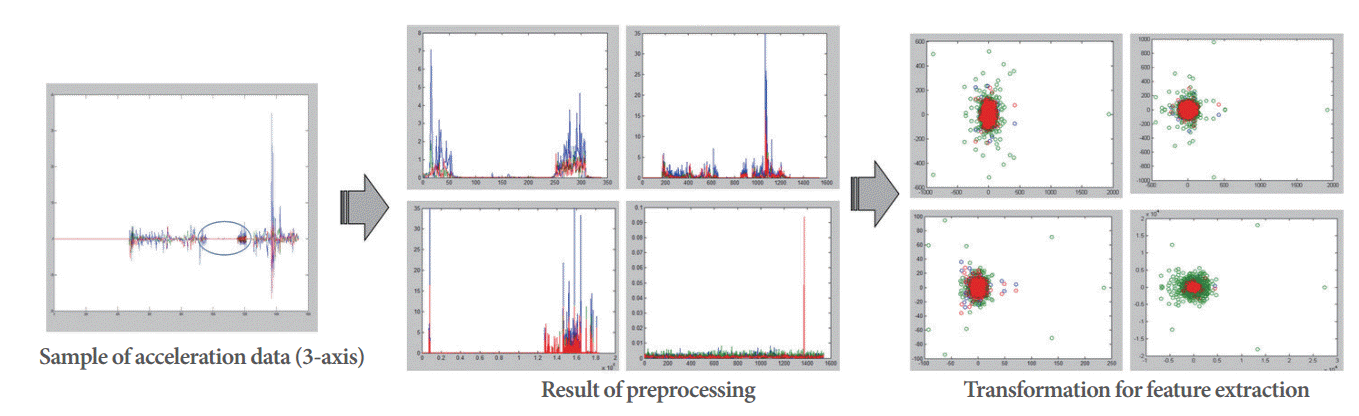
In the preprocessing stage, the acceleration data and tilt angle data collected from the patient’s smart band were converted into a simpler form for analysis. To acquire real-time data from the smart band over a certain period of time (including vibration signals), the absolute value of the signals was calculated and then compared with the set threshold value to determine the occurrence of vibration signals. Recognition may be difficult if the patterns look similar but differ in their location in the time domain during pattern comparison. The issue of mapping signals acquired from different times can be resolved if the signals in the time domain are converted into signals in the frequency domain, since signals with identical characteristics will be located together in the frequency domain.
Feature extraction process
During feature extraction, the most essential information that describes each pattern is identified after analyzing the characteristics of the data. Extracting features instead of using the original data can not only save computation and memory, but also eliminate unnecessary information included in the data. First, we confirmed the urination activity features of the accelerometer and tilt angle signal data in the spatial domain. The features of urination activity are different from those of other daily activities. The feature extraction contained 3 stages: forward movement (when the patient prepares for urination), urination, and backward movement (when the patient cleans up after urination). Fig. 3 briefly shows the feature pattern.
Feature information can be used to detect features that allow urination and daily activities to be distinguished even after a specific space conversion, making it ultimately possible to recognize the frequency of urination. The final urination recognition results were provided after taking into account the acceleration data and the tilt angle data of the 3 stages.
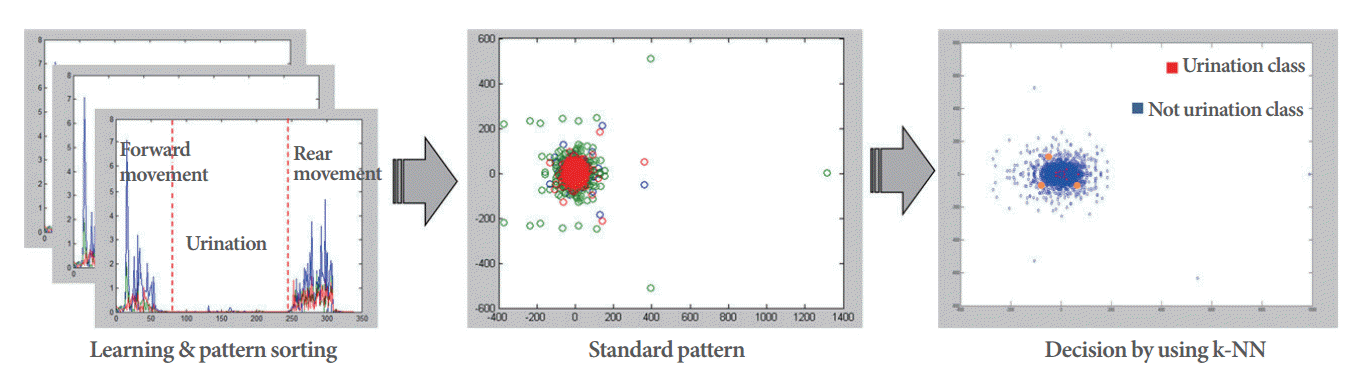
Pattern sorting process
The urination data features extracted from the feature extraction process were sorted using a classifier to detect urination. If similar features are sorted into a feature space, they should be sorted using a nonlinear classifier since the decision field generally has nonlinear characteristics. In this study, patterns were sorted using the k-nearest-neighbors (k-NN) method, a nonlinear classifier of sorts. First, the standard patterns for each class were saved. A standard pattern was defined as a pattern in which the signal data showing the characteristics of the 3 stages of urination were normalized. After calculating the distance between the saved standard patterns and the signal data, the results were passed onto the final stage, in which urination recognition was performed. The classification rule based on this basic principle is called minimum distance classification. Standard patterns must be selected beforehand for each class for minimum distance classification. The minimum distance classification procedure is as follows. For a class of ω i i = 1 c y i i = 1 m y i i = 1 m
The basic minimum distance classification rule given in above formula selects k minimum-distance neighbors of X, and can be expanded by applying the majority rule, which is called the k-NN rule. The k-NN classifier based on the k-NN rule can be generated by the pattern classification algorithm as follows:
• Input:
The difference k of the NN rule; the entry pattern X; the number of standard patterns m; the number of pattern classes C; the pair (Yi, ji) of the standard pattern Yi, 1≤i≤m, and its class ji, 1≤ji≤m.
• Output:
The class number I, to which the entry pattern belongs.
(1) After carrying out S ← { ( y i , j i ) } i = 1 m y - x = m i n y i - x i = 1 m , ( y , j ) ∈ S
(2) If k=1, end after I=j0. If not, reset to I C ( i 1 ) ← 0 , i 1 ≠ j 0 ; I C ( j 0 ) ← 1
(3) Repeatedly carry out the next steps k–1 times.
(a) Find (y1,j0) that satisfies the
(b) Carry out IC (j0)←IC (j0)+1, S←S–{(y, j0)}
(4) End after I←argmax I C ( i ) i = 1 c
Calculating final pattern similarity
In this stage, the final recognition rates of the acceleration data and tilt angle data were calculated. Similarities within the accelerometer data were calculated and adjusted using a weighted value of 0.65, and the final tilt angle was calculated with a weighted value of 0.35. Compared to the clinical guidelines, the weighted values that exhibited the most optimal recognition rate were calculated experimentally. Generally, the importance of the acceleration data was somewhat higher for optimizing accurate urination recognition. The following algorithm shows the process through which the final urination recognition likelihood was calculated by assigning weighted values to the acceleration data and tilt angle data:
where S is 1, 2, 3 (=x, y, z) in the 3-axis (acceleration, tilt angle) data obtained from signals throughout the day, D1 and D2 correspond to the distance based on the acceleration data and tilt angle data, and α1, α2 are weighted values as explained above. Based on the results derived from the above algorithm, if the final pattern similarity was greater than 90%, it was determined that urinary activity was present. The frequency and time of the instances of urination were then derived.
RESULTS
Preprocessing and feature extraction
To acquire real-time data from the smart band over a certain period of time (including vibration signals), the absolute value of the signals was calculated and then compared with the set threshold value to determine the occurrence of vibration signals. The process and results of this conversion are shown in Fig. 4.
Pattern sorting and recognition
The feature extraction process involved 3 stages: forward movement (when the patient prepares for urination), urination, and backward movement (when the patient cleans up after urination). The final urination recognition results were obtained after taking into account the acceleration data and the tilt angle data of the 3 stages. Fig. 5 shows a sample of the final recognition signals detected from pattern classification.
Experiment
An experiment was carried out to assess the performance of the recognition technology proposed in this study. A total of 20 patients were selected, and the performance of the algorithm was assessed based on the data (acceleration, tilt angle) collected from smart bands for 50 days. The final accuracy of the algorithm was calculated based on voiding charts verified by urologists. The comparative evaluation of the proposed method utilized the threshold method [12] and the commonly used SVM method [15]. This comparative evaluation was performed in order to ensure that the classification was as usable as possible. We used a confusion matrix for this experiment, in which the accuracy, sensitivity, and specificity of the suggested algorithm and the typical algorithm were compared. True positive (TP), false positive (FP), false negative (FN), and true negative (TN) results were defined as follows:
TP: A match for urination is determined to correctly reflect a real urination event.
FP: A match for urination is determined not to reflect a real urination event.
TN: A nonmatch for urination is determined to correctly reflect the absence of urination.
FN: A non-match for urination is determined to correspond to a real urination event.
The confusion matrix was calculated, and the average results are shown below (Table 1). Based on the confusion matrix, accuracy, sensitivity, and specificity can be calculated as follows (Fig. 6):
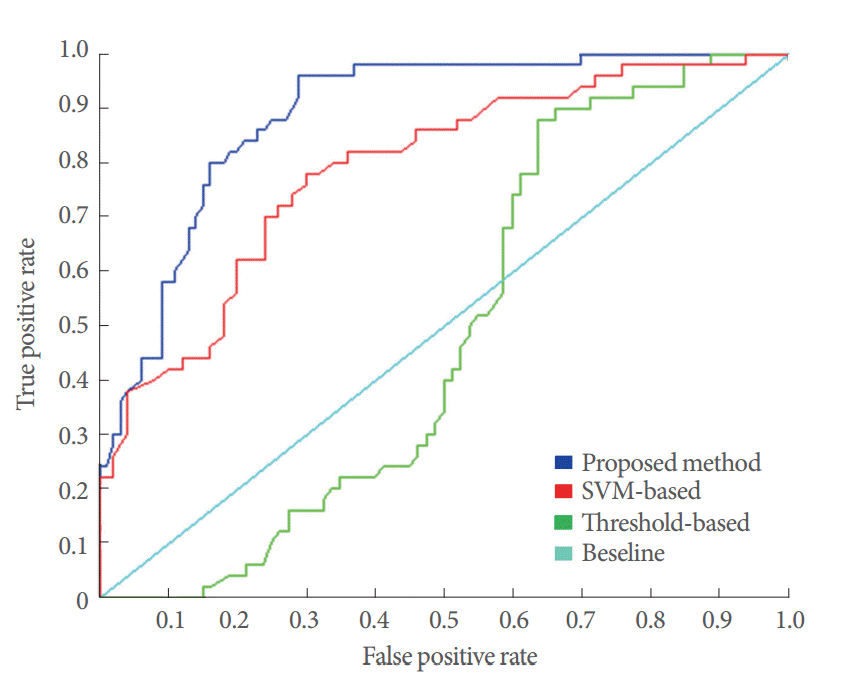
The calculated confusion matrix and the accuracy, sensitivity, and specificity results confirmed that the suggested method was more accurate than the traditional algorithms. The suggested method was further confirmed to be more effective with a receiver operating characteristic (ROC) curve. ROC curves are often used in medical science and dynamics. An ROC curve is drawn based on the average value of the sensitivity and specificity of the measured values. As shown in Fig. 7, an area under the curve (AUC) of 1 would represent perfect results. If the AUC is 0.5 or less, the method is not useful. AUC values of 0.9–1 represent very accurate results, and values of 0.7–0.89 represent comparatively accurate results. The ROC curve method further confirmed that our algorithm led to more accurate results than the existing comparison methods.
The experiment showed a high average accuracy rate of 90.4%, proving the robustness of the proposed algorithm. In fact, the threshold method should be applied only to specific criteria, and incorrect results were derived when the individual differences were large. For SVM, inaccurate results were derived with respect to the values of features in the vicinity of the boundary line, and the SVM method has the limitation of requiring a 3-dimensional method to be used. Overall, the results were highly accurate during the morning, afternoon, and evening, but they were less accurate during the early hours for some patients with less movement (average, 72.4%). This issue seems to arise from the similarity in the motionless section during the stage of urination recognition to movements during sleep. To resolve this issue, 2 methods can be considered: a higher weighted value could be given for the tilt angle data regarding urination recognition during sleep by identifying the time on the smart band, or a deep-learning method based on a recurrent neural network (RNN) could be used after the accumulation of sufficient data.
DISCUSSION
This study developed and applied an automatic urination recognition algorithm to examine the feasibility of developing an automated urination management system for male patients with dysuria. The process of the proposed urination recognition technology began with the collection of acceleration data and tilt angle data through smart bands, which were then analyzed using the k-NN algorithm, a machine-learning method that derives recognition results after comparative analyses with standardized feature patterns. The final optimal recognition results were derived by assigning different weighted values to the results of feature similarity between each set of accelerometer data and the results of feature similarity between each set of tilt angle data. An experiment was conducted to evaluate the performance of this algorithm, targeting actual patients with dysuria. The performance evaluation was carried out based on test data collected over a 50-day period from 20 patients. Since an average accuracy of 90.4% was obtained, the feasibility of urination recognition was positive. However, while the results were highly accurate during daily activities, they were less accurate during sleeping hours, due to the similarity between the urination stage of the processing model and periods with less movement during sleep. To resolve this issue, 2 methods will be explored in the future: a higher weighted value could be given for the tilt angle data during sleeping hours, or a general algorithm could be developed to manage the urination of patients at all times, taking into account a deep-learning method based on an RNN. In addition, the subjects of this study were limited to males only, and in the future, we will explore mechanisms of urination recognition for female patients.